If you’re still using the traditional RSI, perhaps it’s time for a change:
Use this new "Advanced RSI (A-RSI) for Tradingview" indicator to find high-probability pullback trade setups AND divergence-based reversals
A silver bullet? Obviously NO. But it does help me find all the trade setups I’ll ever need. Check this out:
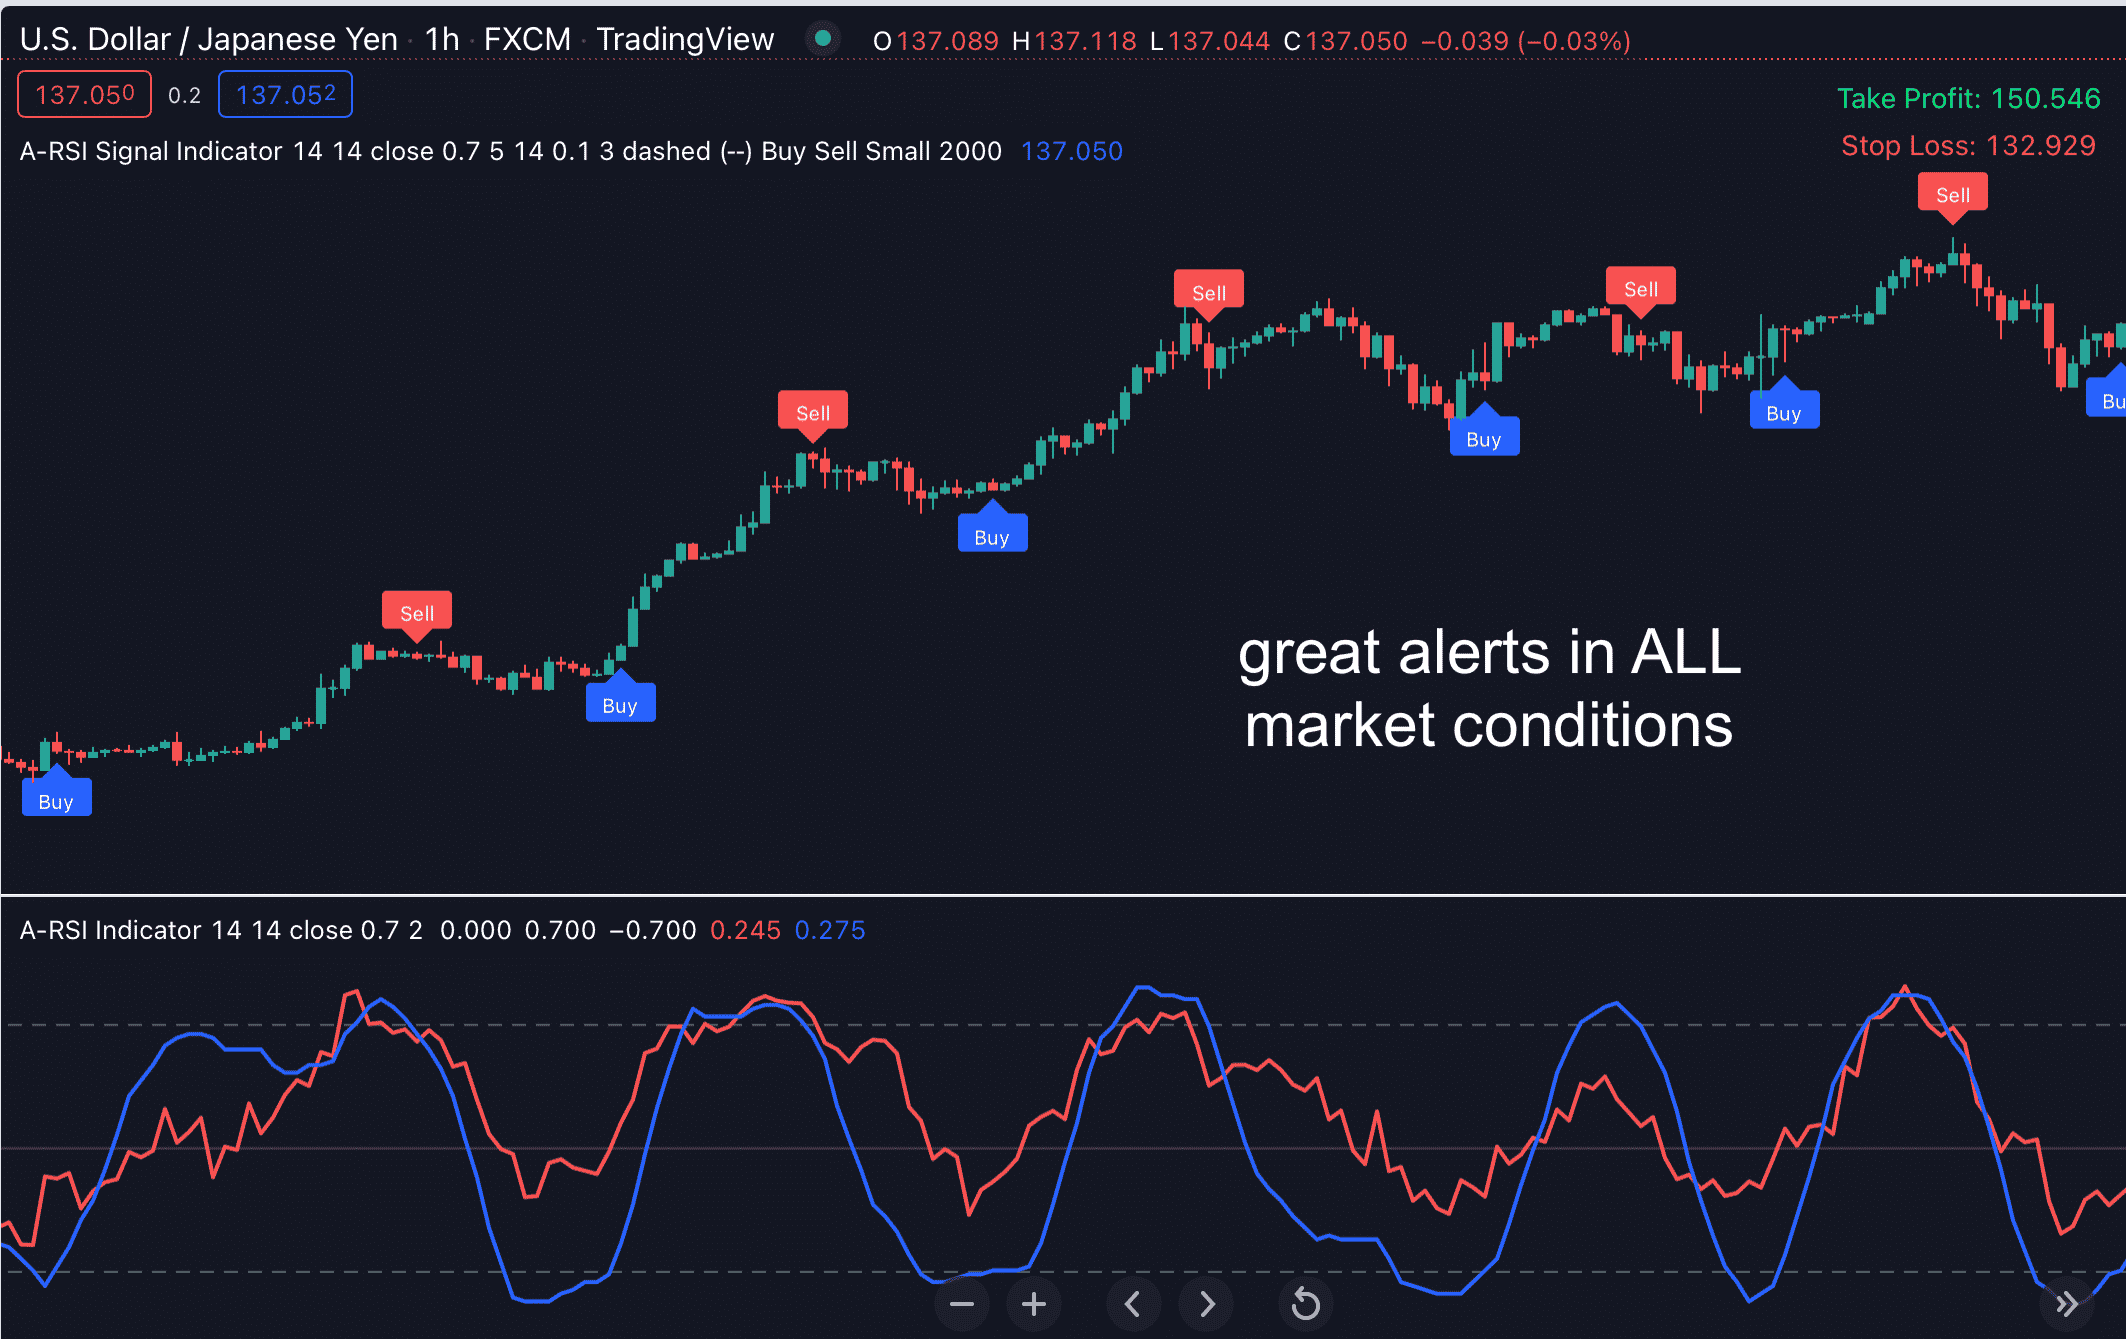
Pin-point pullback and reversal entries
Detect trend reversals by spotting divergences.
Reduce false signals
What exactly is this indicator?
Take the classic, well known RSI, fused with our peculiar tweaks, and here you have the A-RSI, an absolute beast that identifies when prices change direction with great timing.
… and it works in both trending and sideways markets.
In a nutshell, A-RSI is the more advanced version of the classic RSI indicator empowered by our proprietary algorithm.
It is a great tool that fits perfectly in any trading strategy, be it reversal, range or trend trading.
Here’s how it works:
A-RSI is a VERSATILE tool for pinpointing when the price changes direction
When the market is moving sideways, it’s difficult to find good trade setups because of the small movements and low volatility.
When the market is trending, it’s tricky to identify good entry points which come after a short counter-trend move or a period of consolidation.
That’s exactly when A-RSI comes in handy, because…
It’s a versatile tool you may use to identify high-probability trade opportunities during ranging & trending markets
A-RSI is built on the classic, super well known Relative Strength Index (RSI), which first became a hit in 1978.
RSI measures recent price changes to identify overbought or oversold conditions, which signal an imminent price correction.
As simple as it seems, the idea behind it is so elegant, it works for decades in MULTIPLE markets.
But… our A-RSI really takes it to the NEXT level…
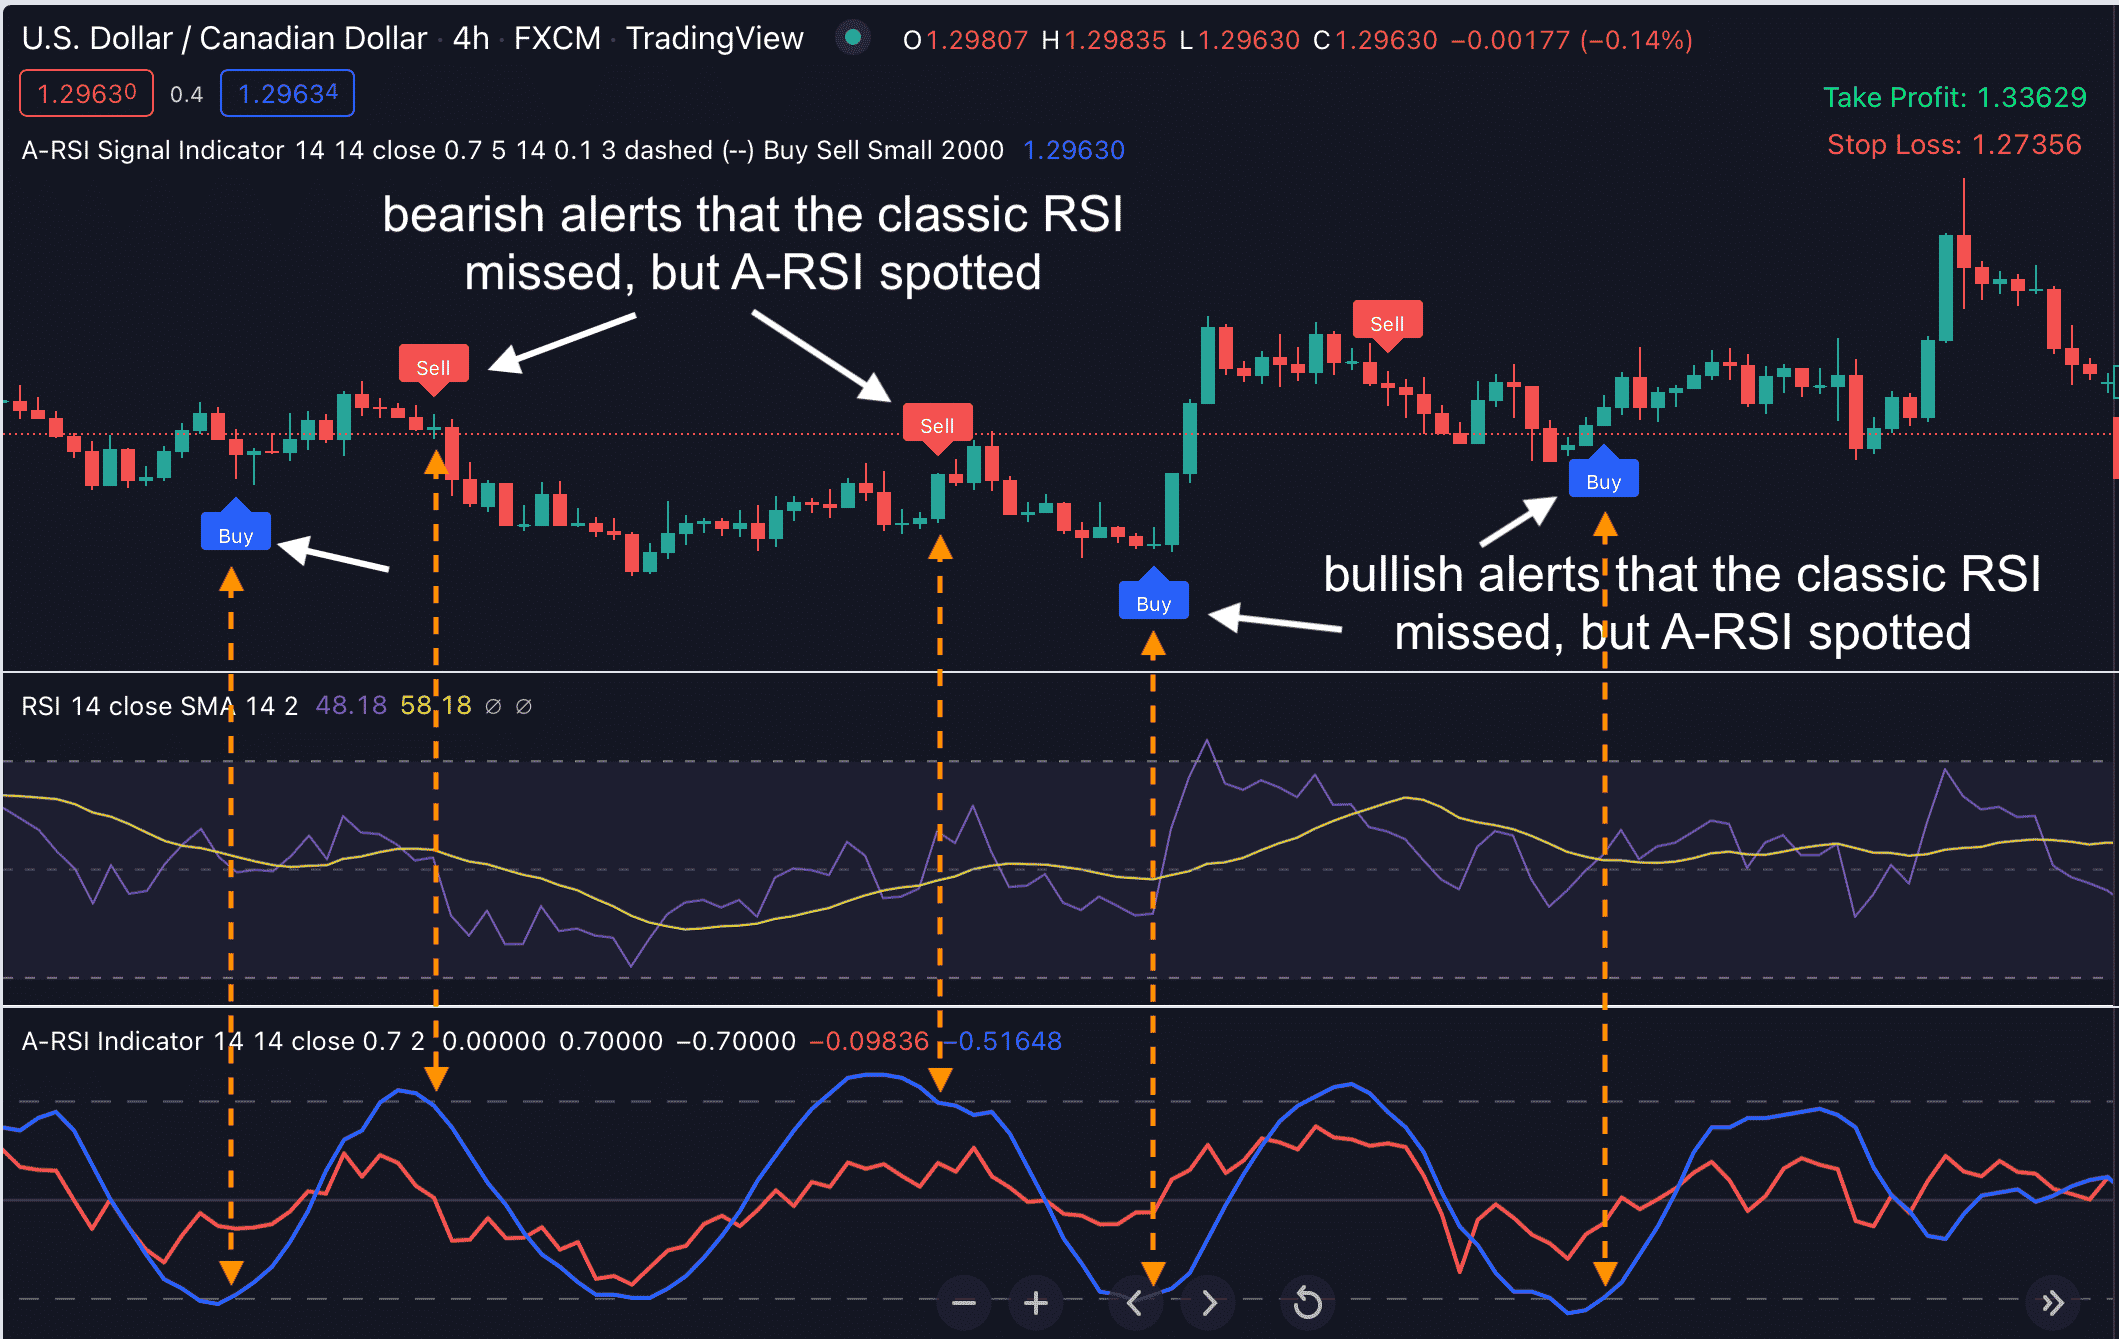
A-RSI spots many great trade setups that RSI may miss…
From the chart above, A-RSI identified the first bullish alert, while the classic RSI missed that trade setup. After that, A-RSI spotted 3 bearish alerts as pullback entries, but the classic RSI also missed those great trade setups.
Anyway, here’s another interesting feature of A-RSI
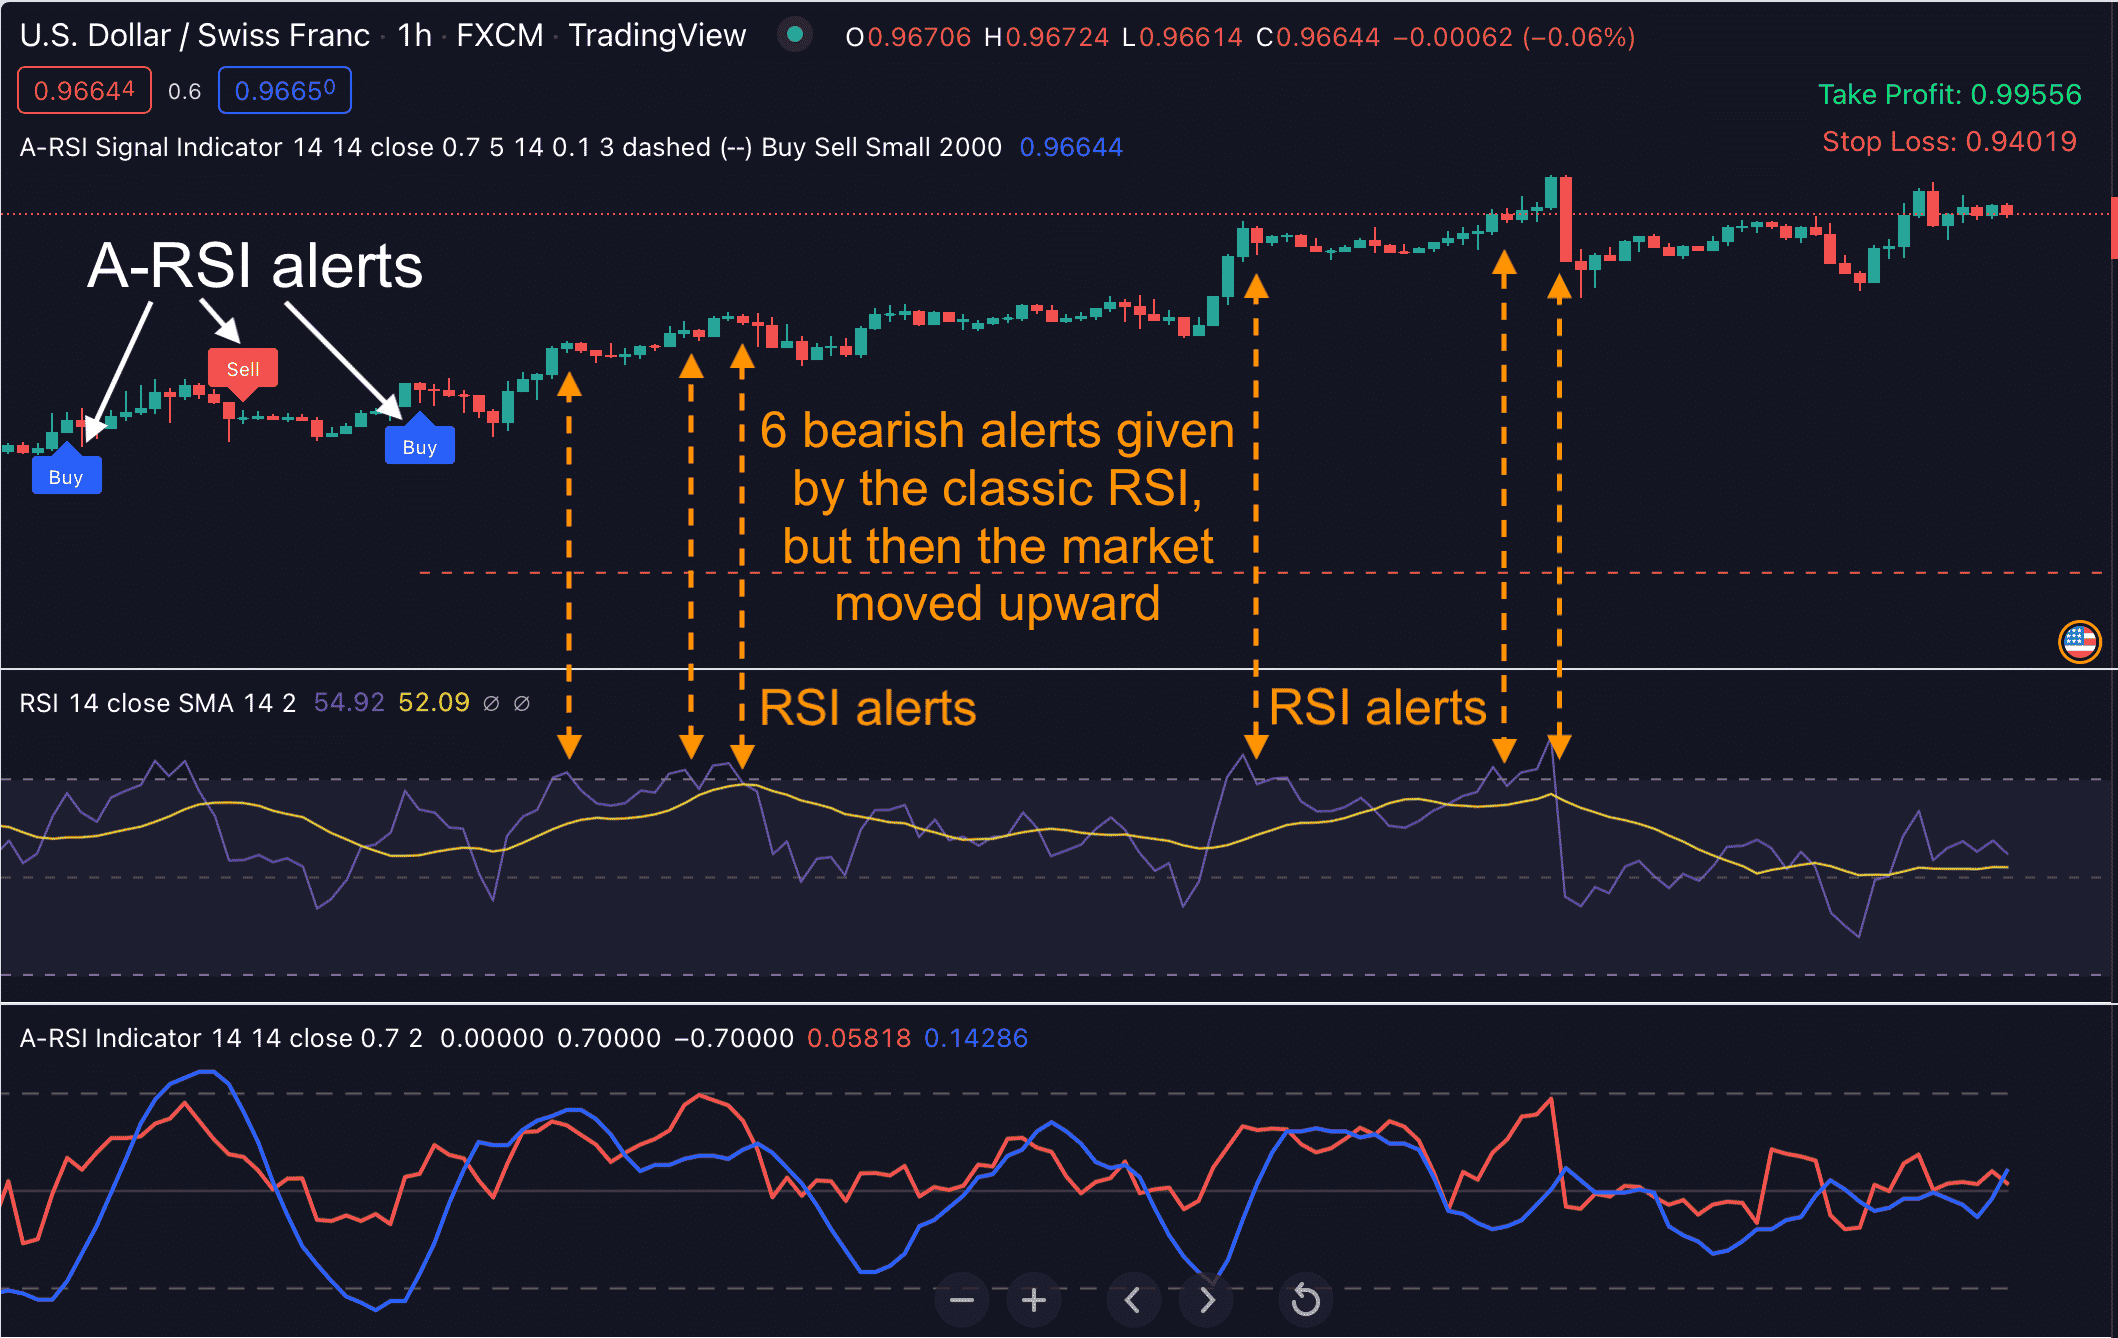
A-RSI is more sensitive to variations of price changes...
You can see from the chart above, the 2 bearish alerts given by the classic RSI were false signals, because the market moved sideways or upward right after the alerts. The 2 bullish alerts given by A-RSI were still accurate, because the price moved upward after that.
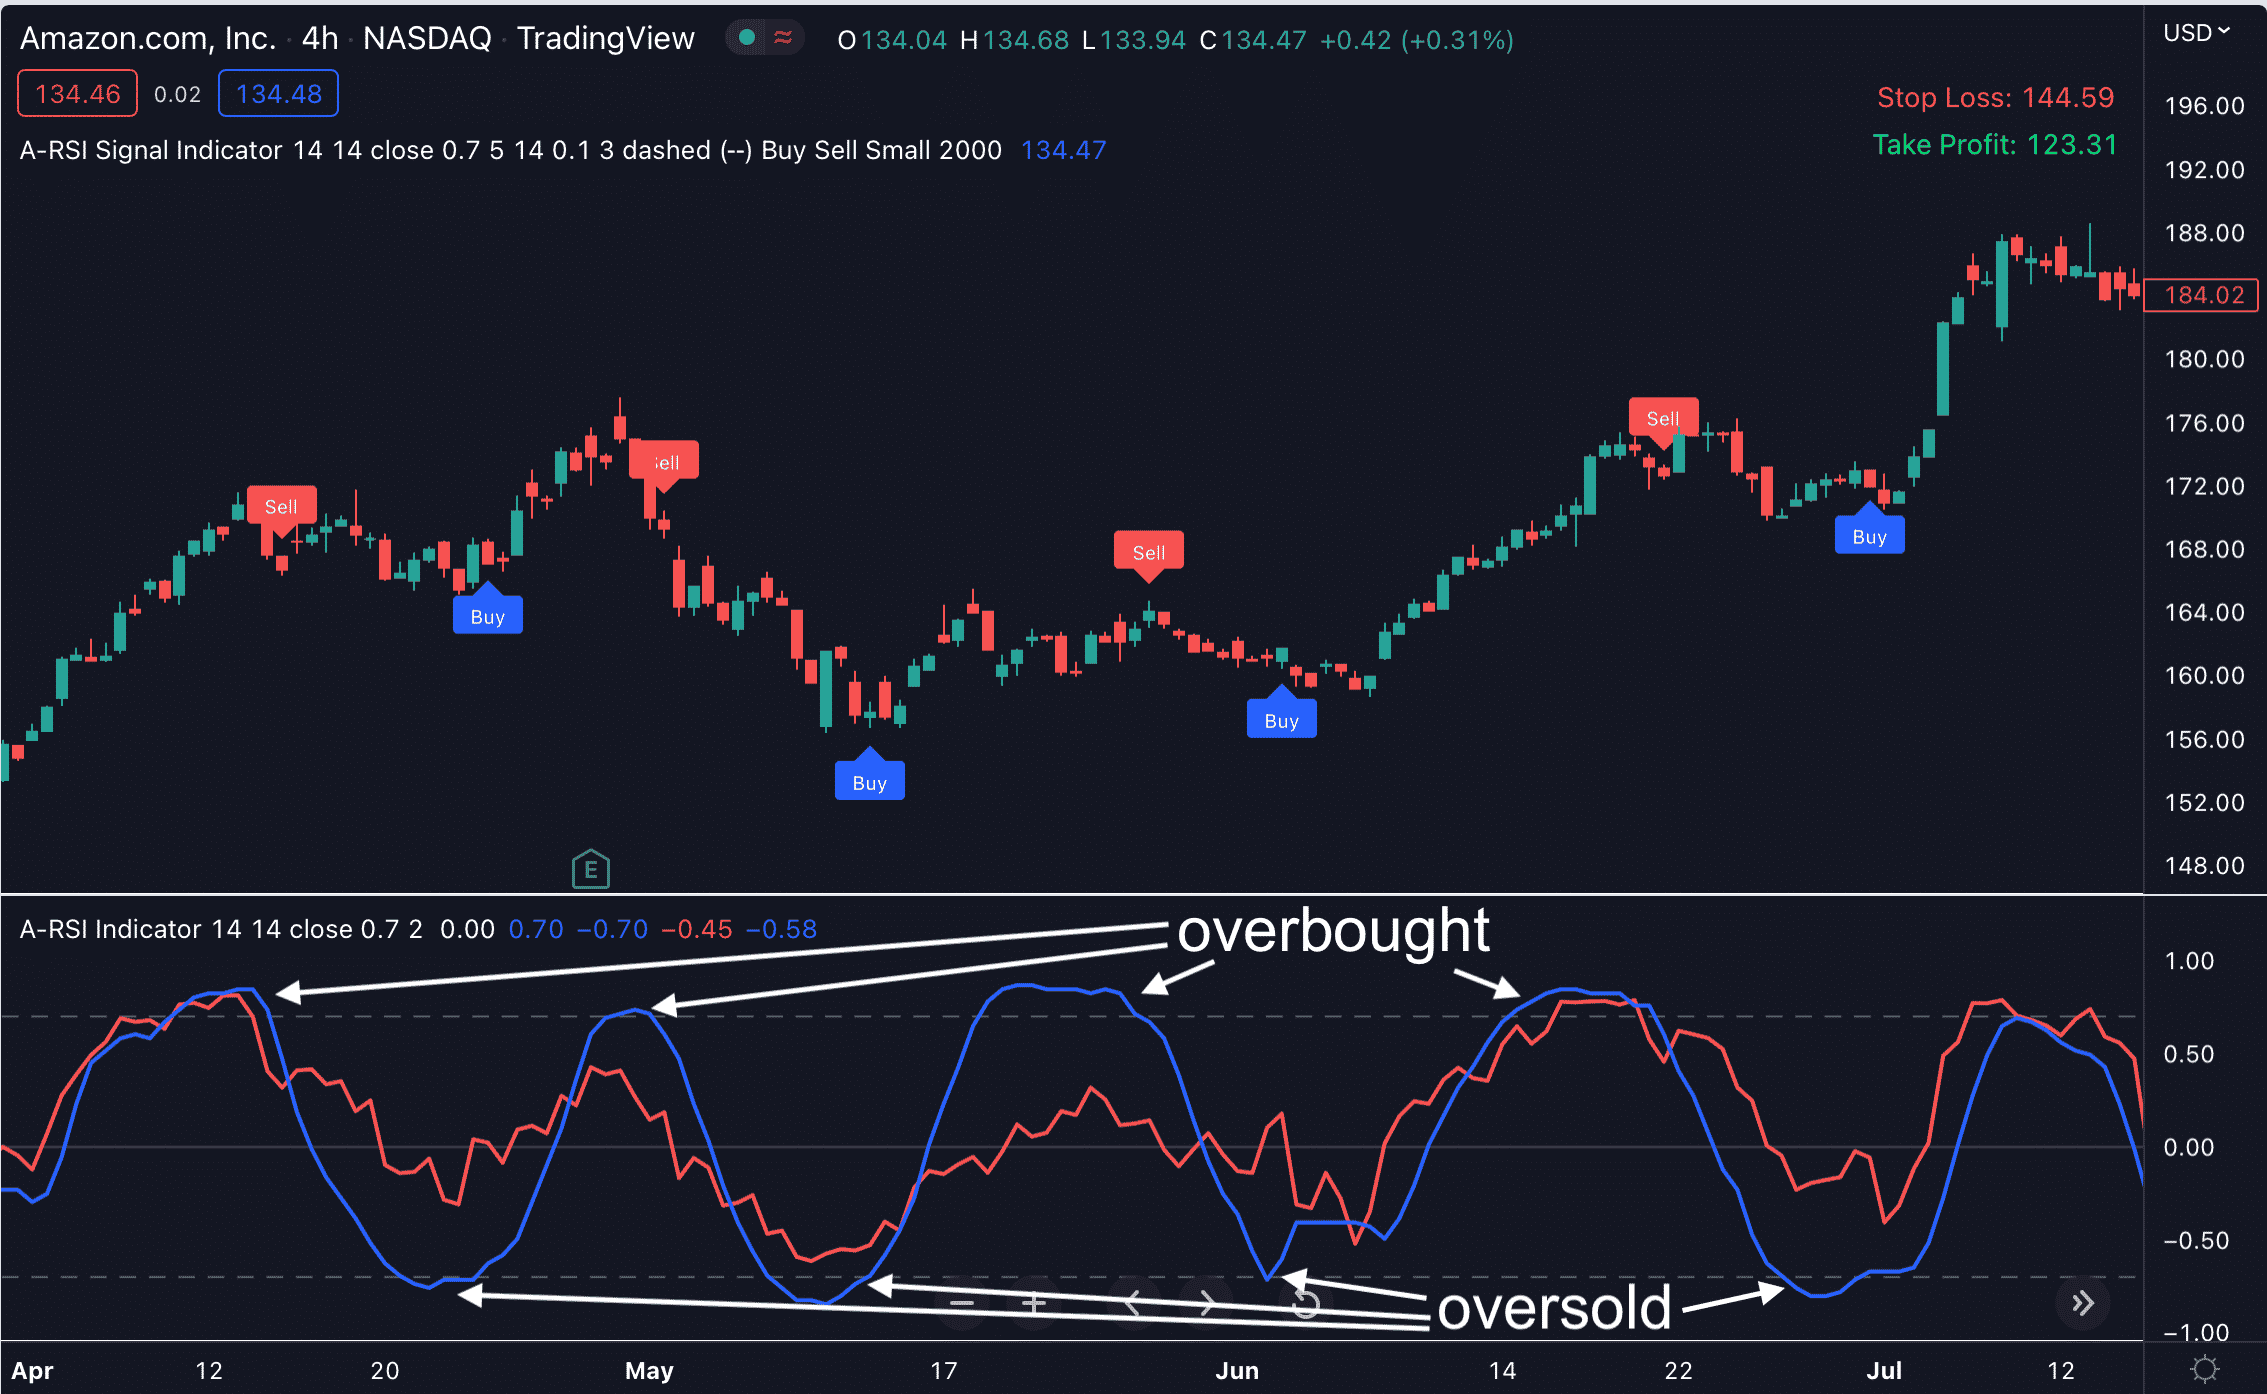
Take a look at this exciting chart below.
I’m so excited with this indicator, I could go on for days and nights about it.
But let me just share with you some of my personal trading strategies you can easily apply this to…
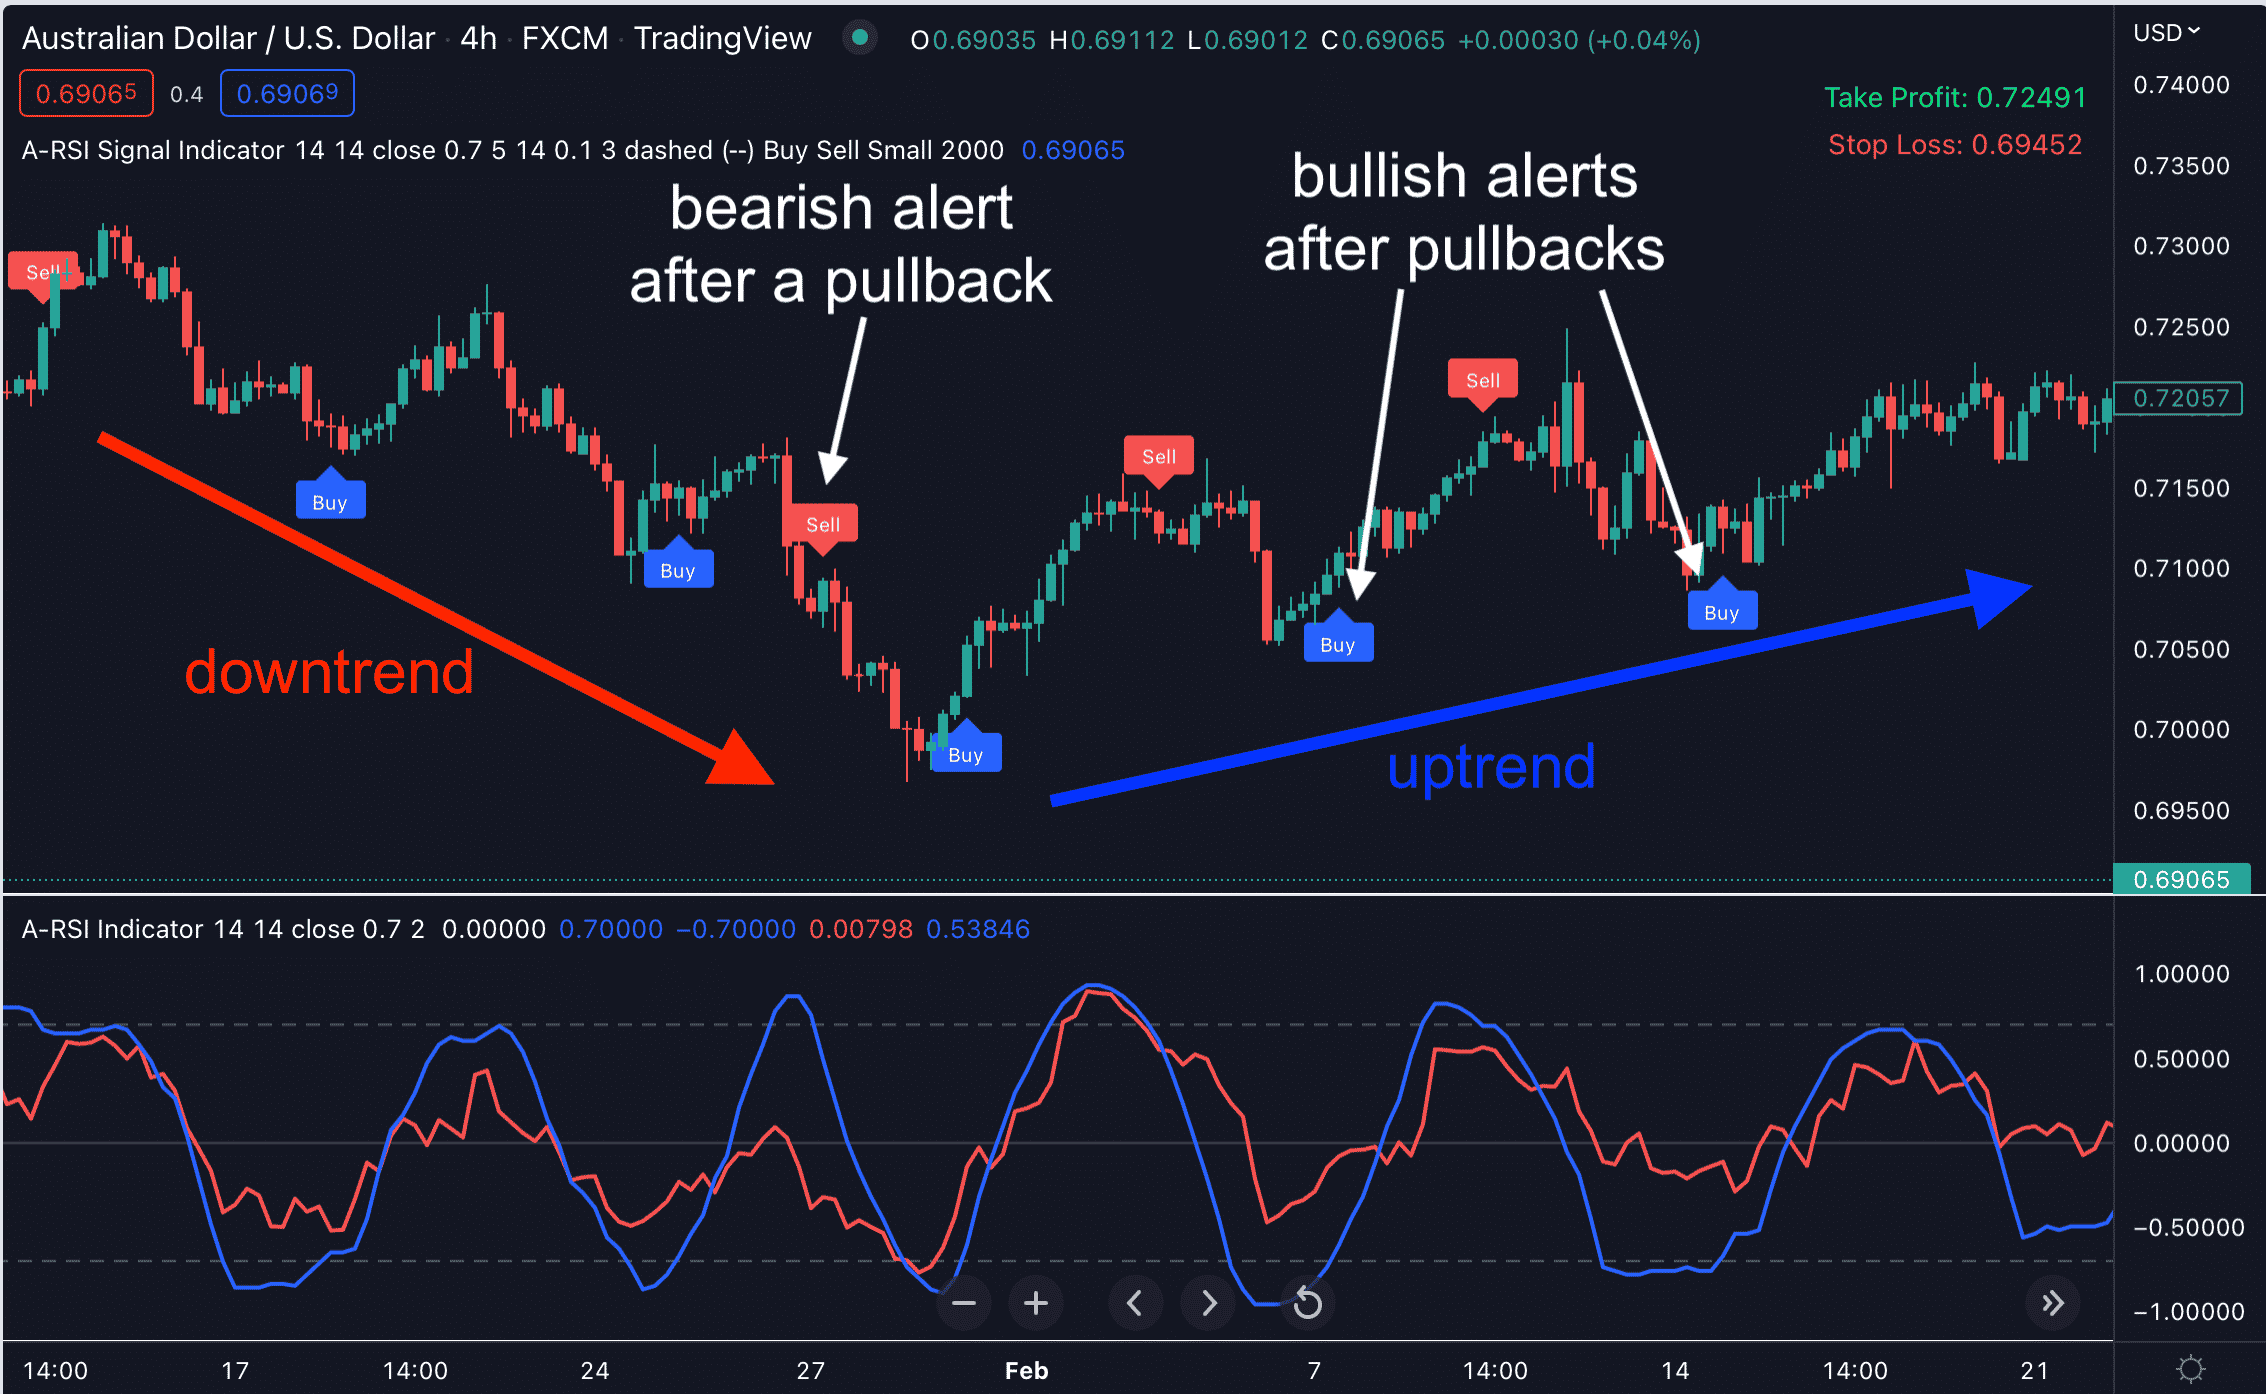
Identify great pullback entries when the market is trending…
Profiting with this classic pullback trading is harder than it looks.
However, A-RSI makes it much easier for you.
In trending markets, A-RSI give me an easy way to trade pullbacks. It gives you low-risk entries with good reward-to-risk ratio.
My personal trading rule is simple:
In an uptrend, enter when the A-RSI indicator signals oversold conditions (its value is below -0.7). And in a downtrend, enter when the indicator signals overbought conditions (its value is above +0.7).
The blue or red arrow flagged by A-RSI indicates the position where a price correction takes place. The price will reverse after a pullback and move in the direction of the prevailing trend.
A-RSI is particularly helpful when it comes to spotting divergences and trend reversals…
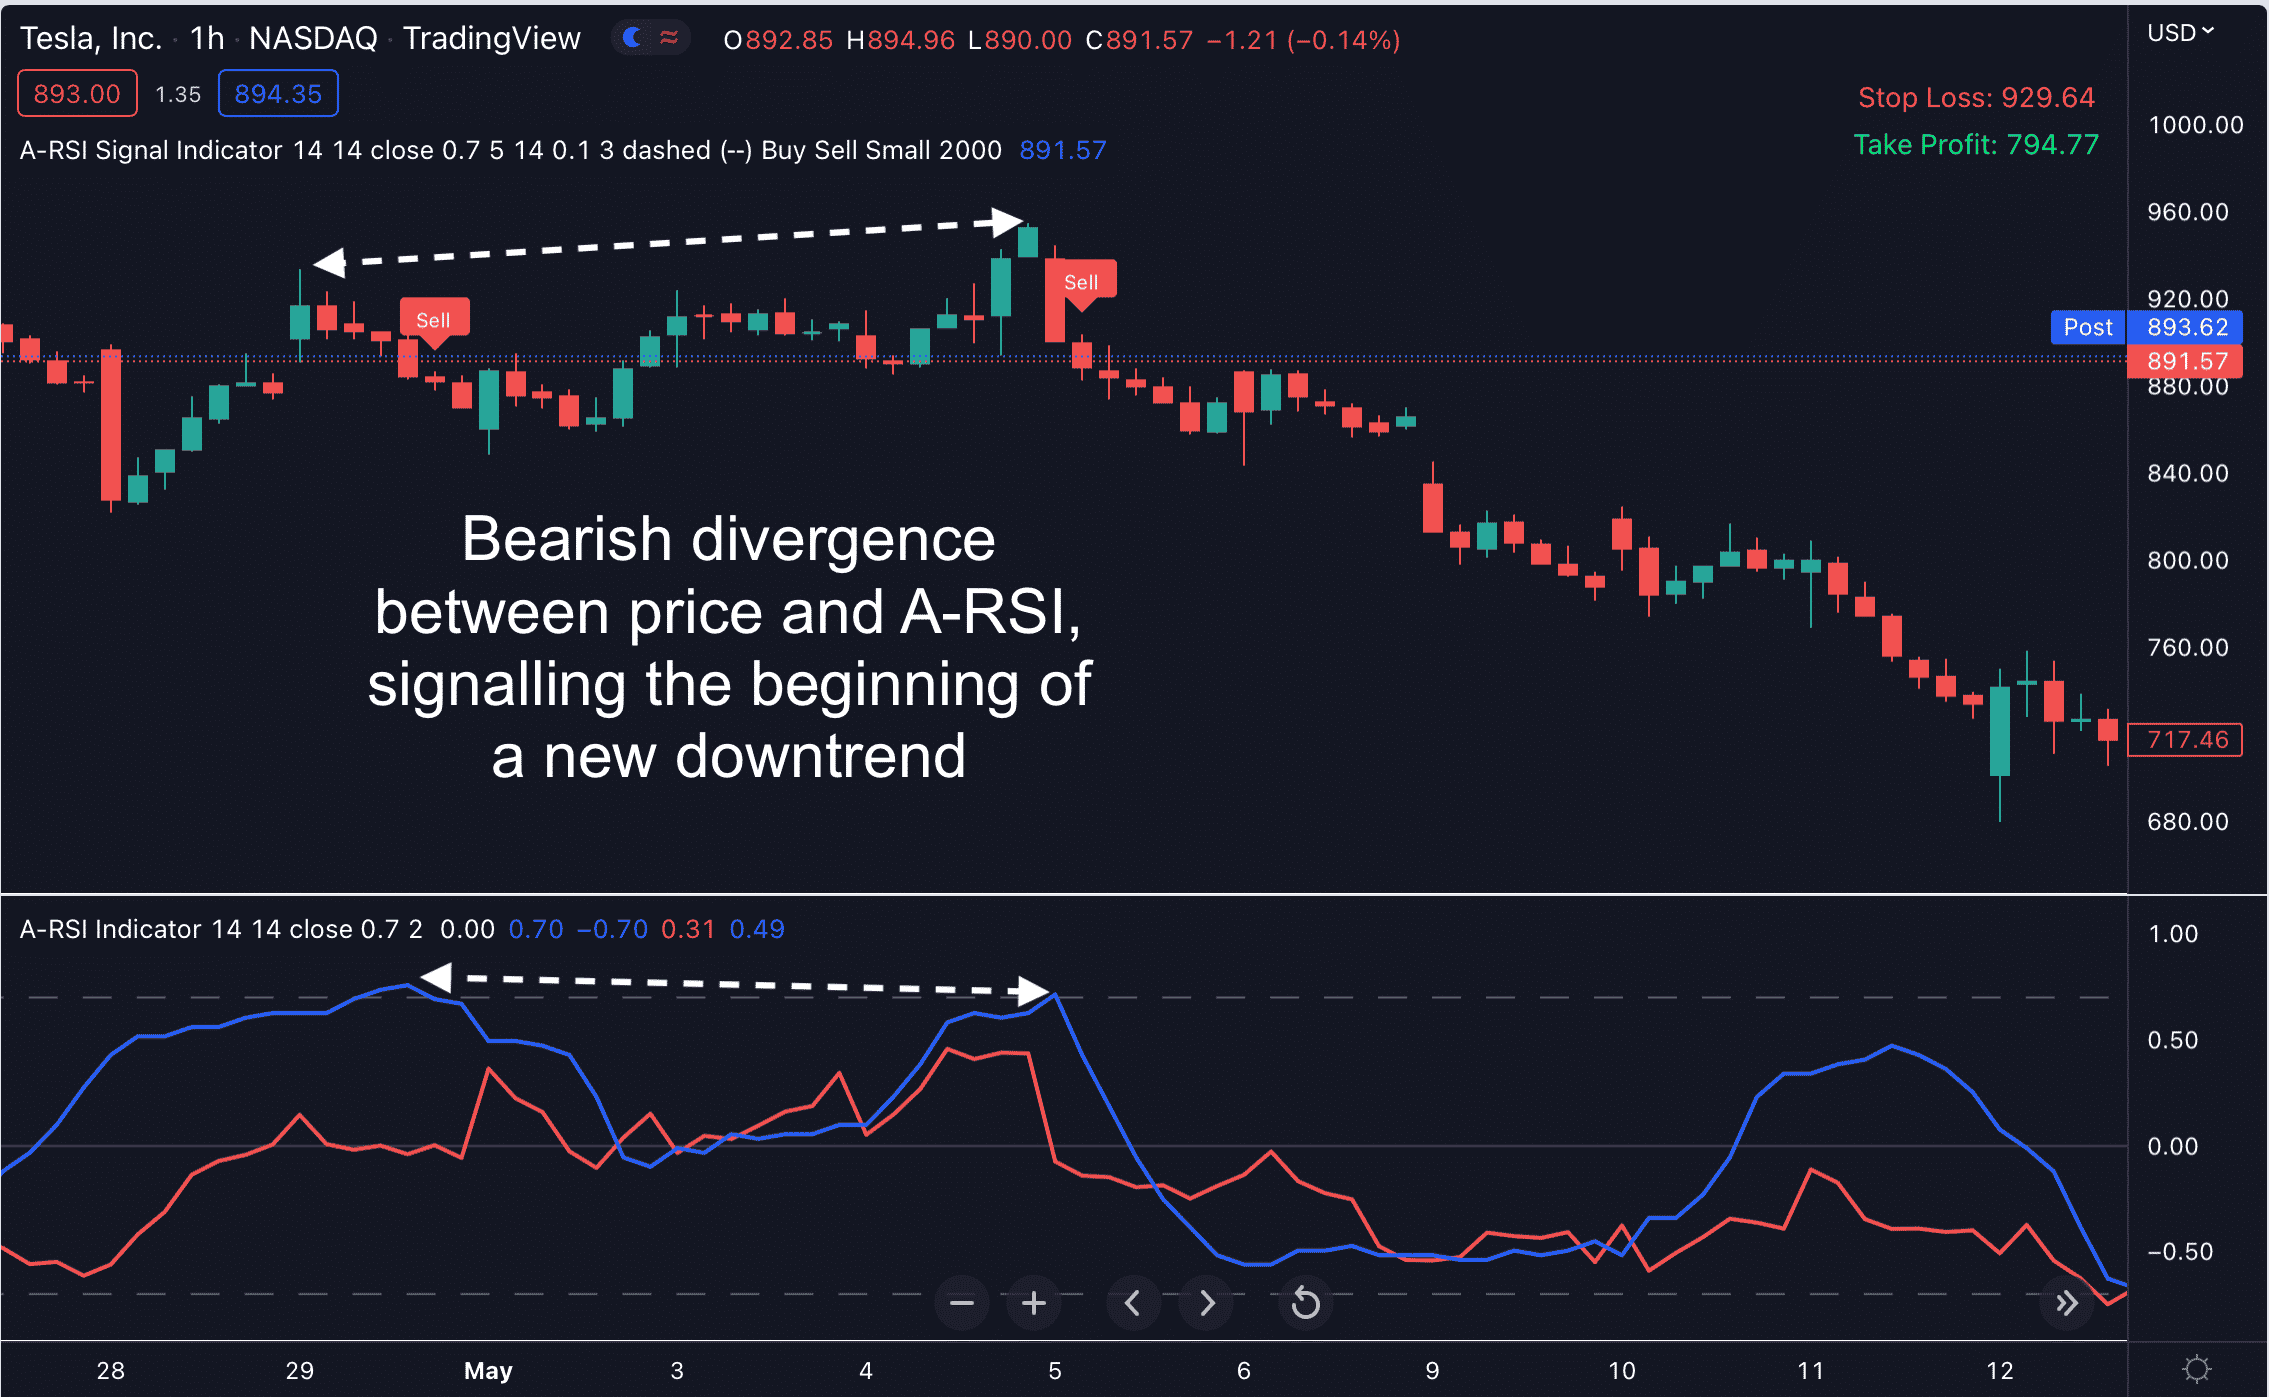
A-RSI is very useful for detecting divergences which may be great signals for the beginning of major uptrends/downtrends.
When a bullish divergence is detected, the current downtrend is exhausted and we can expect a trend reversal. That could be the beginning of a new major uptrend.
Likewise, when a bearish divergence is detected, the existing uptrend is weakened. And we can expect the price to reverse and start a new downtrend.
Being able to detect a trend reversal is about to happen, you can open a position right at the beginning of a new trend and rake in profit.
Have a look at this exciting chart to know how to spot divergences and trend reversals.
But Hang On... We're Not Done...
Further down this page, you’ll notice there are THREE purchase options you can choose.
Option 1: You can get A-RSI Indicator alone for an insanely generous price today.
Option 2: Or… you can invest a little more and get our A-RSI – Trio bundle
So What’s Exactly is this Better Trend Trading – Duo Bundle?
- First off, you get the A-RSI indicator. And on top of that, you’ll also get access to TWO other TradingView Indicators…
- You’ll get the “Supply Demand Pro” Indicator that Identifies identifies all the STRONGEST supply demand zones for you... (click here for more details)
Option 3: You can join our exclusive TV Champ membership and grab ALL our custom indicators for Tradingview. PLUS all Tradingview indicators that we’ll release in the future. For a small one-time fee.
So What's Inside The "TV Champ" Membership?
First of all, you get the A-RSI Indicator for Tradingview indicator.
And on top of that, you’ll also get access to the ENTIRE collection of our top-rated custom indicators for Tradingview. Including Supply Demand Pro, Order Block Gen, Logic Day Trading, Divergence Solution, Pullback Factor, and many more.
Plus, you’ll also get all Tradingview indicators that we’ll release in the future.
To see the full list of all indicators included in the TV Champ membership, click here…
Get A-RSI Indicator for Tradingview for $299
1 Indicator
Platform: Tradingview-
One-time payment
-
Get A-RSI Indicator for Tradingview
Duo Bundle
Platform: Tradingview-
One-time payment
-
Get A-RSI Indicator for Tradingview
-
PLUS: Supply Demand Pro for Tradingview
TV Champ
Platform: Tradingview-
Get instant access to ALL custom indicators for Tradingview
-
Get ALL updates
-
PLUS: All future indicators we'll release
Common Questions
You’ll get instant access to all of our custom indicators for Tradingview listed here. Plus all future Tradingview indicators we’ll release in the coming months. It’s the best value you can get.
These indicators work on Tradingview (both computers and mobile devices)
Reviews


Company
- Indicator Vault
- Contact us
Made by Indicator Vault
Serious Indicators for Serious Traders

