If you like scalping trading or day trading, you’ll go bananas over this…
This Mix Of Smart Technology & Scientific Trading Approach Gives Birth To My Favorite SCALPING Trading Indicator for Tradingview (Works on Multiple Markets)
Hi there,
This “Scientific Scalper” indicator does most of the heavy lifting for you & identify high-probability trade setups for scalping on the 5-minute, 15-minute, and 1-hour time frames. Its “secret sauce”? The indicator uses an approach that we call “double confirmation”.
Here’s the first confirmation: The indicator analyzes the underlying trend to make sure you always trade with the trend.
Here’s the second confirmation: Once we’re sure the trade is in the direction of the general trend, the indicator’s algorithm then detects when the market is overbought or oversold. So you can be sure the trade setup you get is high-probability.
Let me show you exactly how it works:
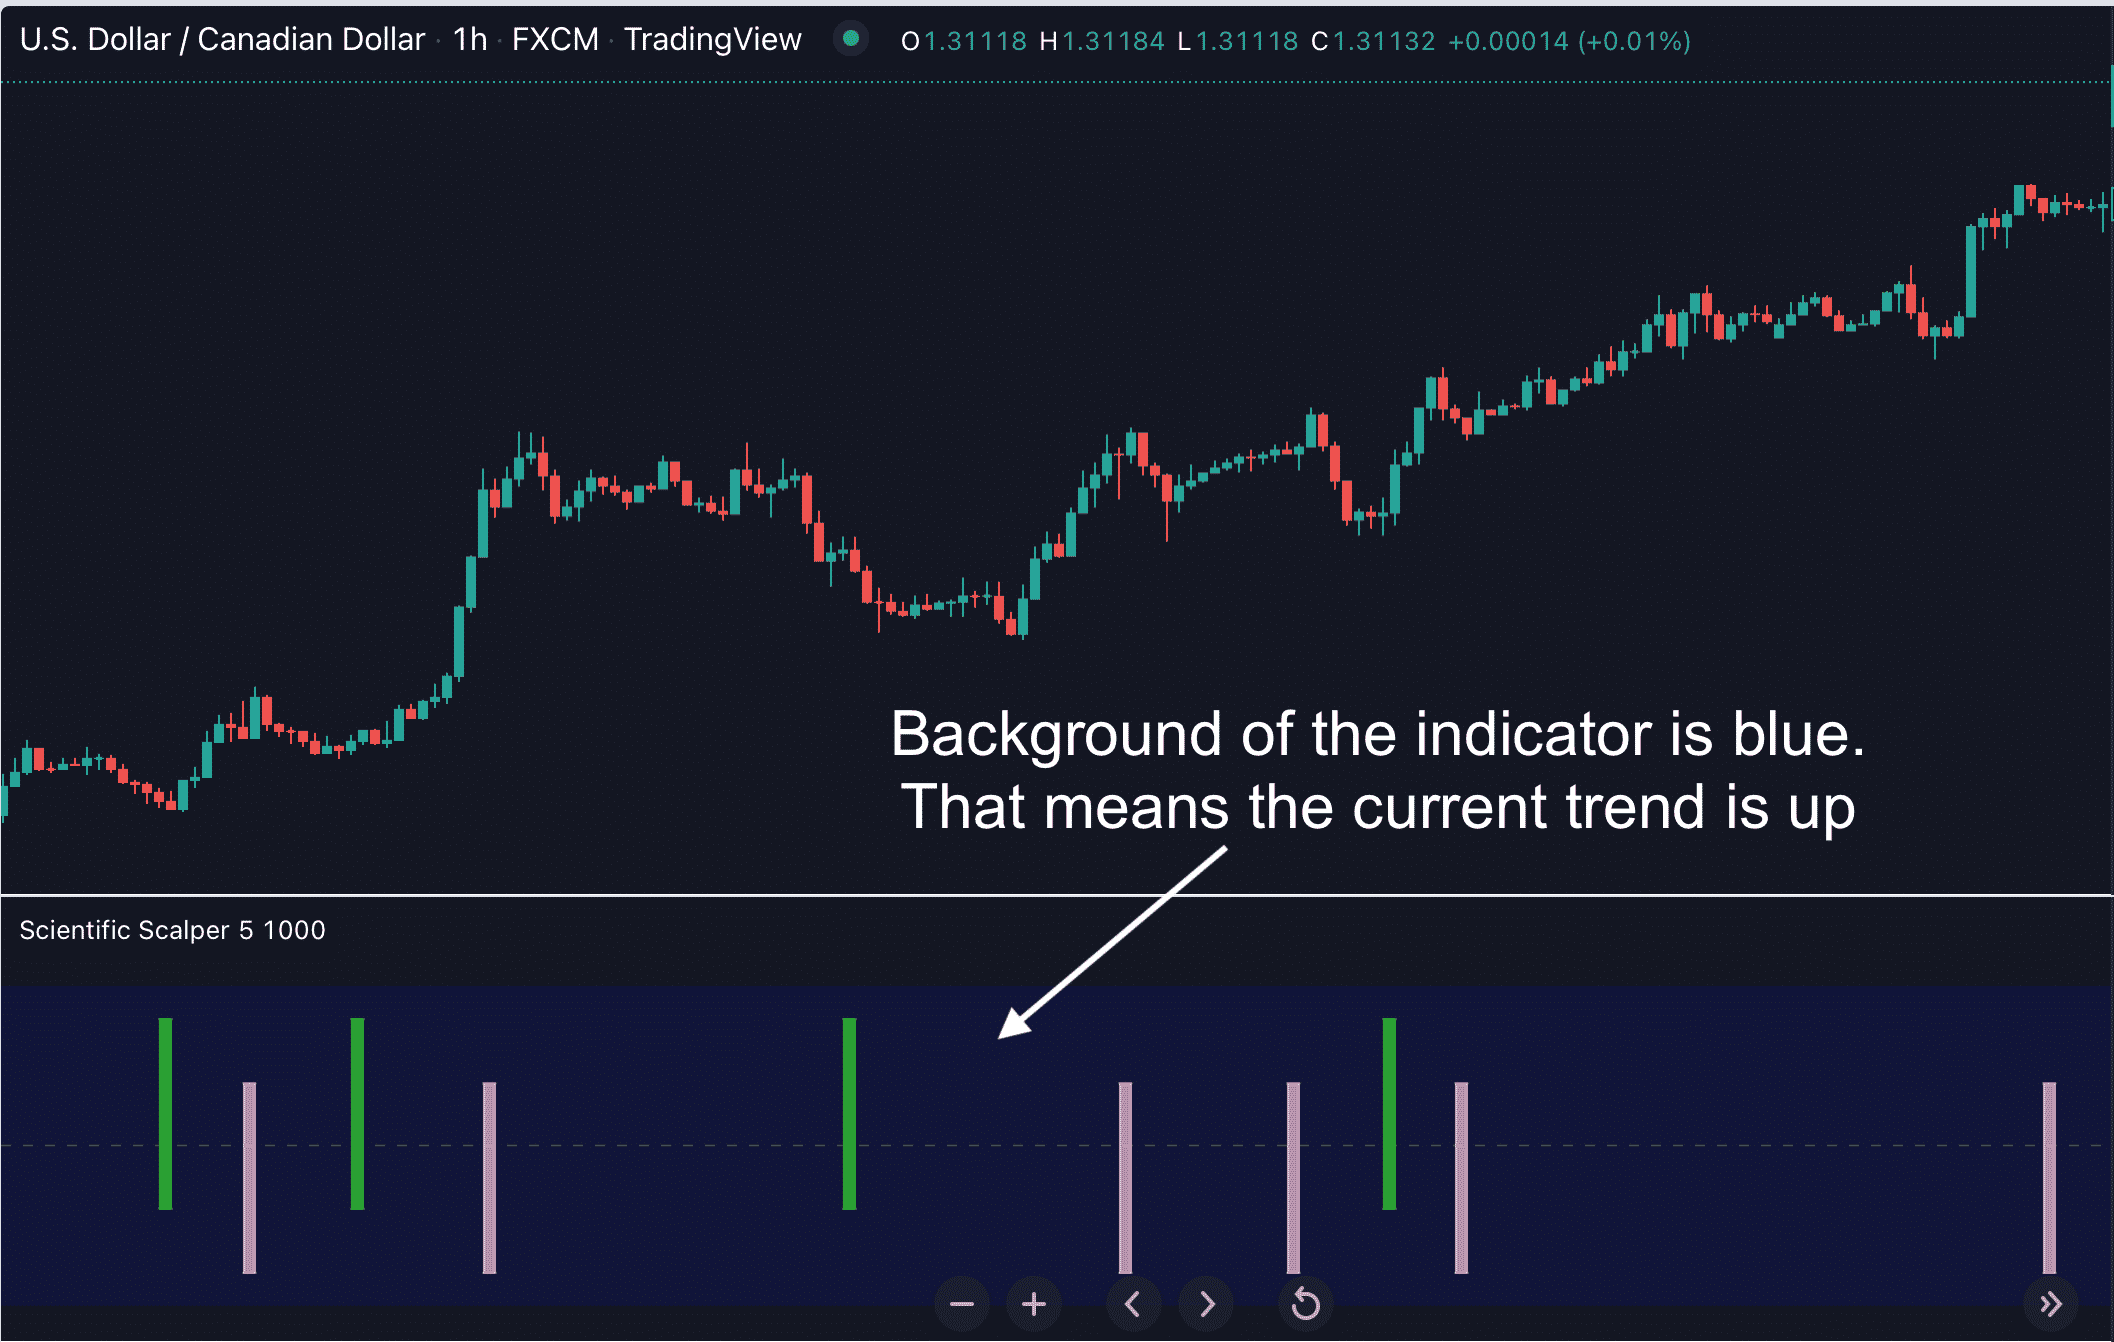
First off, the background of the indicator panel tells you the direction of the current trend...
Here’s what I mean:
And this ability of the indicator to detect the underlying trend is very important. Because this way, you can be sure you always trade WITH the general trend, and not against it.
Now that you’ve identified the general trend, here’s the next thing the “Scientific Scalper” does for you:
Second, the "Scientific Scalper" indicator gives you a timely alert as soon as it detects that the market is overbought or oversold...
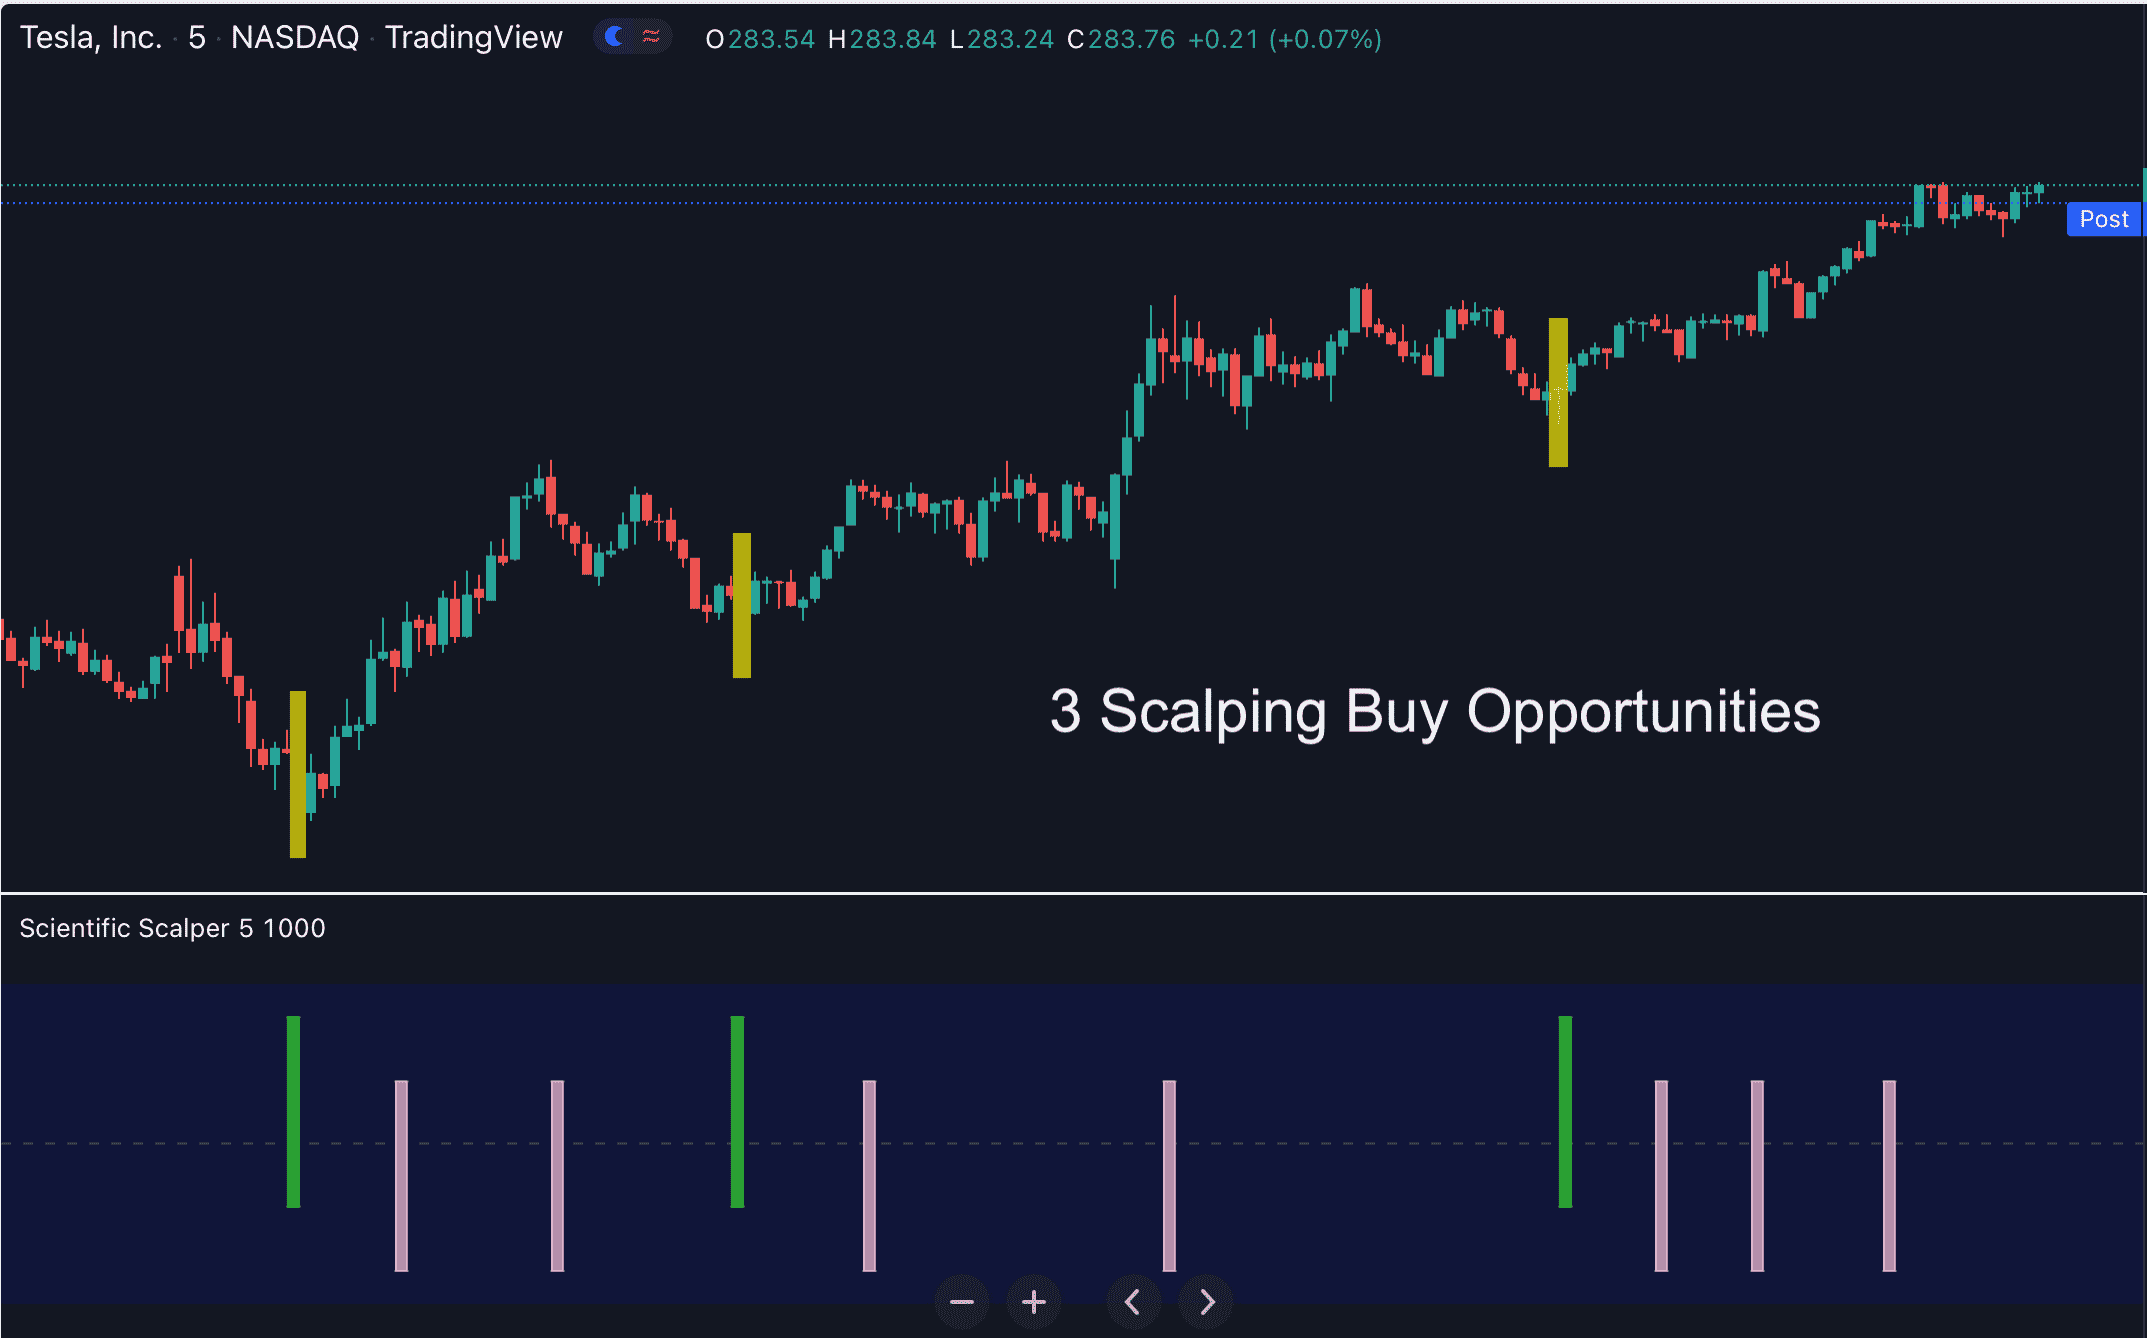
Bullish Trade Setups: Whenever the indicator detects that the market is oversold, it gives you a bullish alert. But to increase probability, only consider this trade setup valid IF the background of the indicator is blue (that means the general trend is up).
In other words, if the background is blue, only bullish setups are considered valid. And we’ll ignore all bearish setups.
Here’s an example to illustrate this point:
Just as the indicator predicted, these 2 setups ended up pretty nice. In addition, the Scientific Scalper indicator also gives us a third buy opportunity which turned out to be as successful. Cool, isn’t it?
Now, let’s talk about…
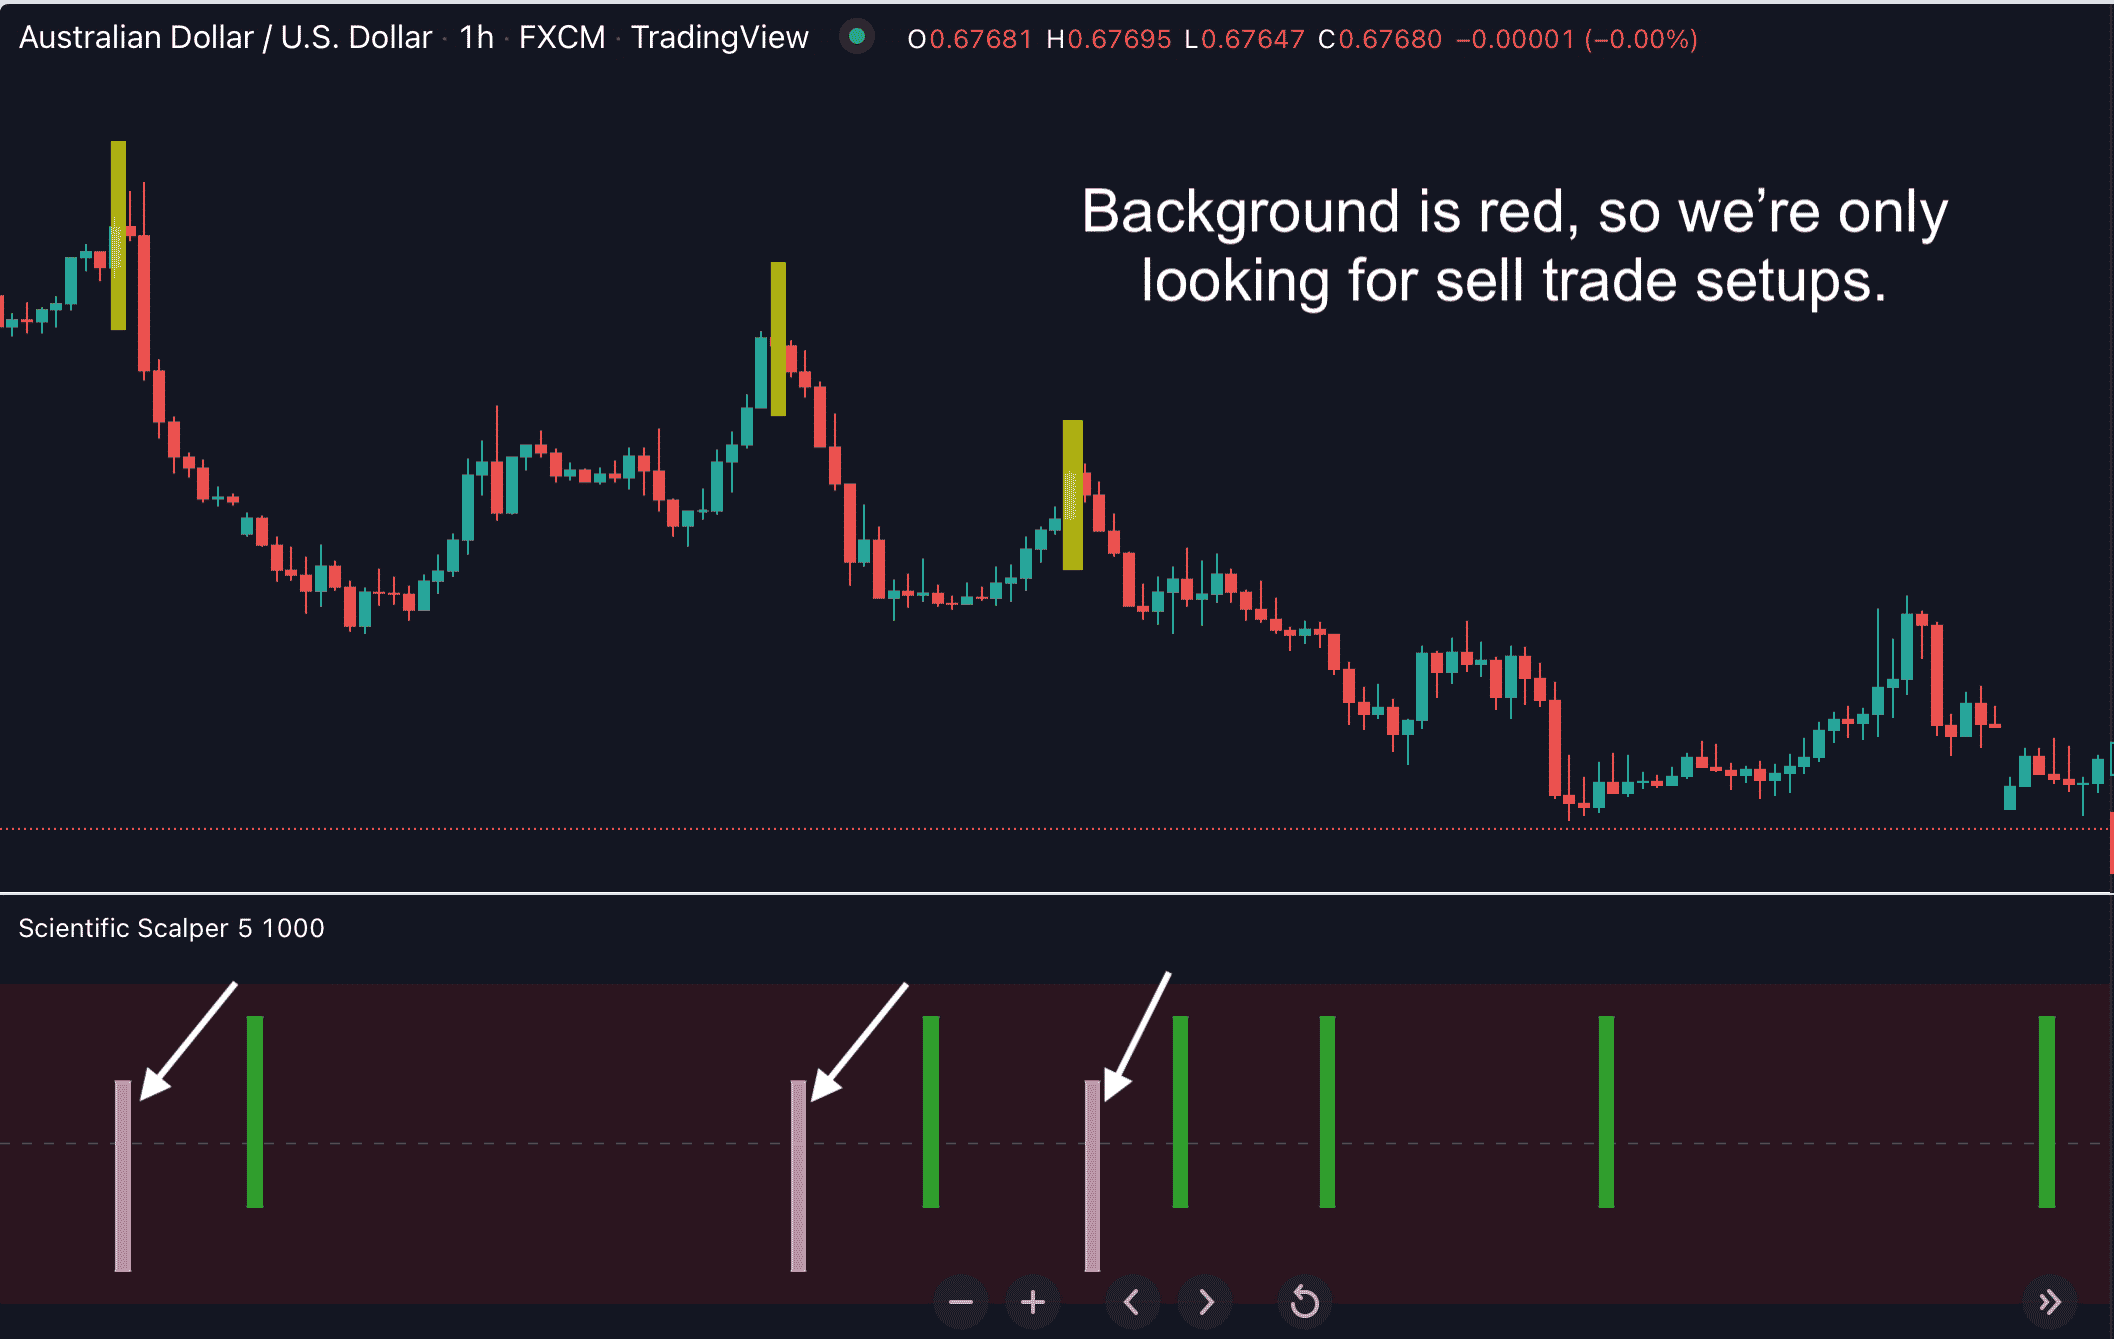
Bearish Trade Setups: Whenever the indicator detects that the market is overbought, it gives you a Sell (red) setup. But to increase probability, only consider this signal valid IF the background of the indicator is red (that means the general trend is down).
In other words, if the background is red, only sell setups are considered valid. And we’ll ignore all long positions.
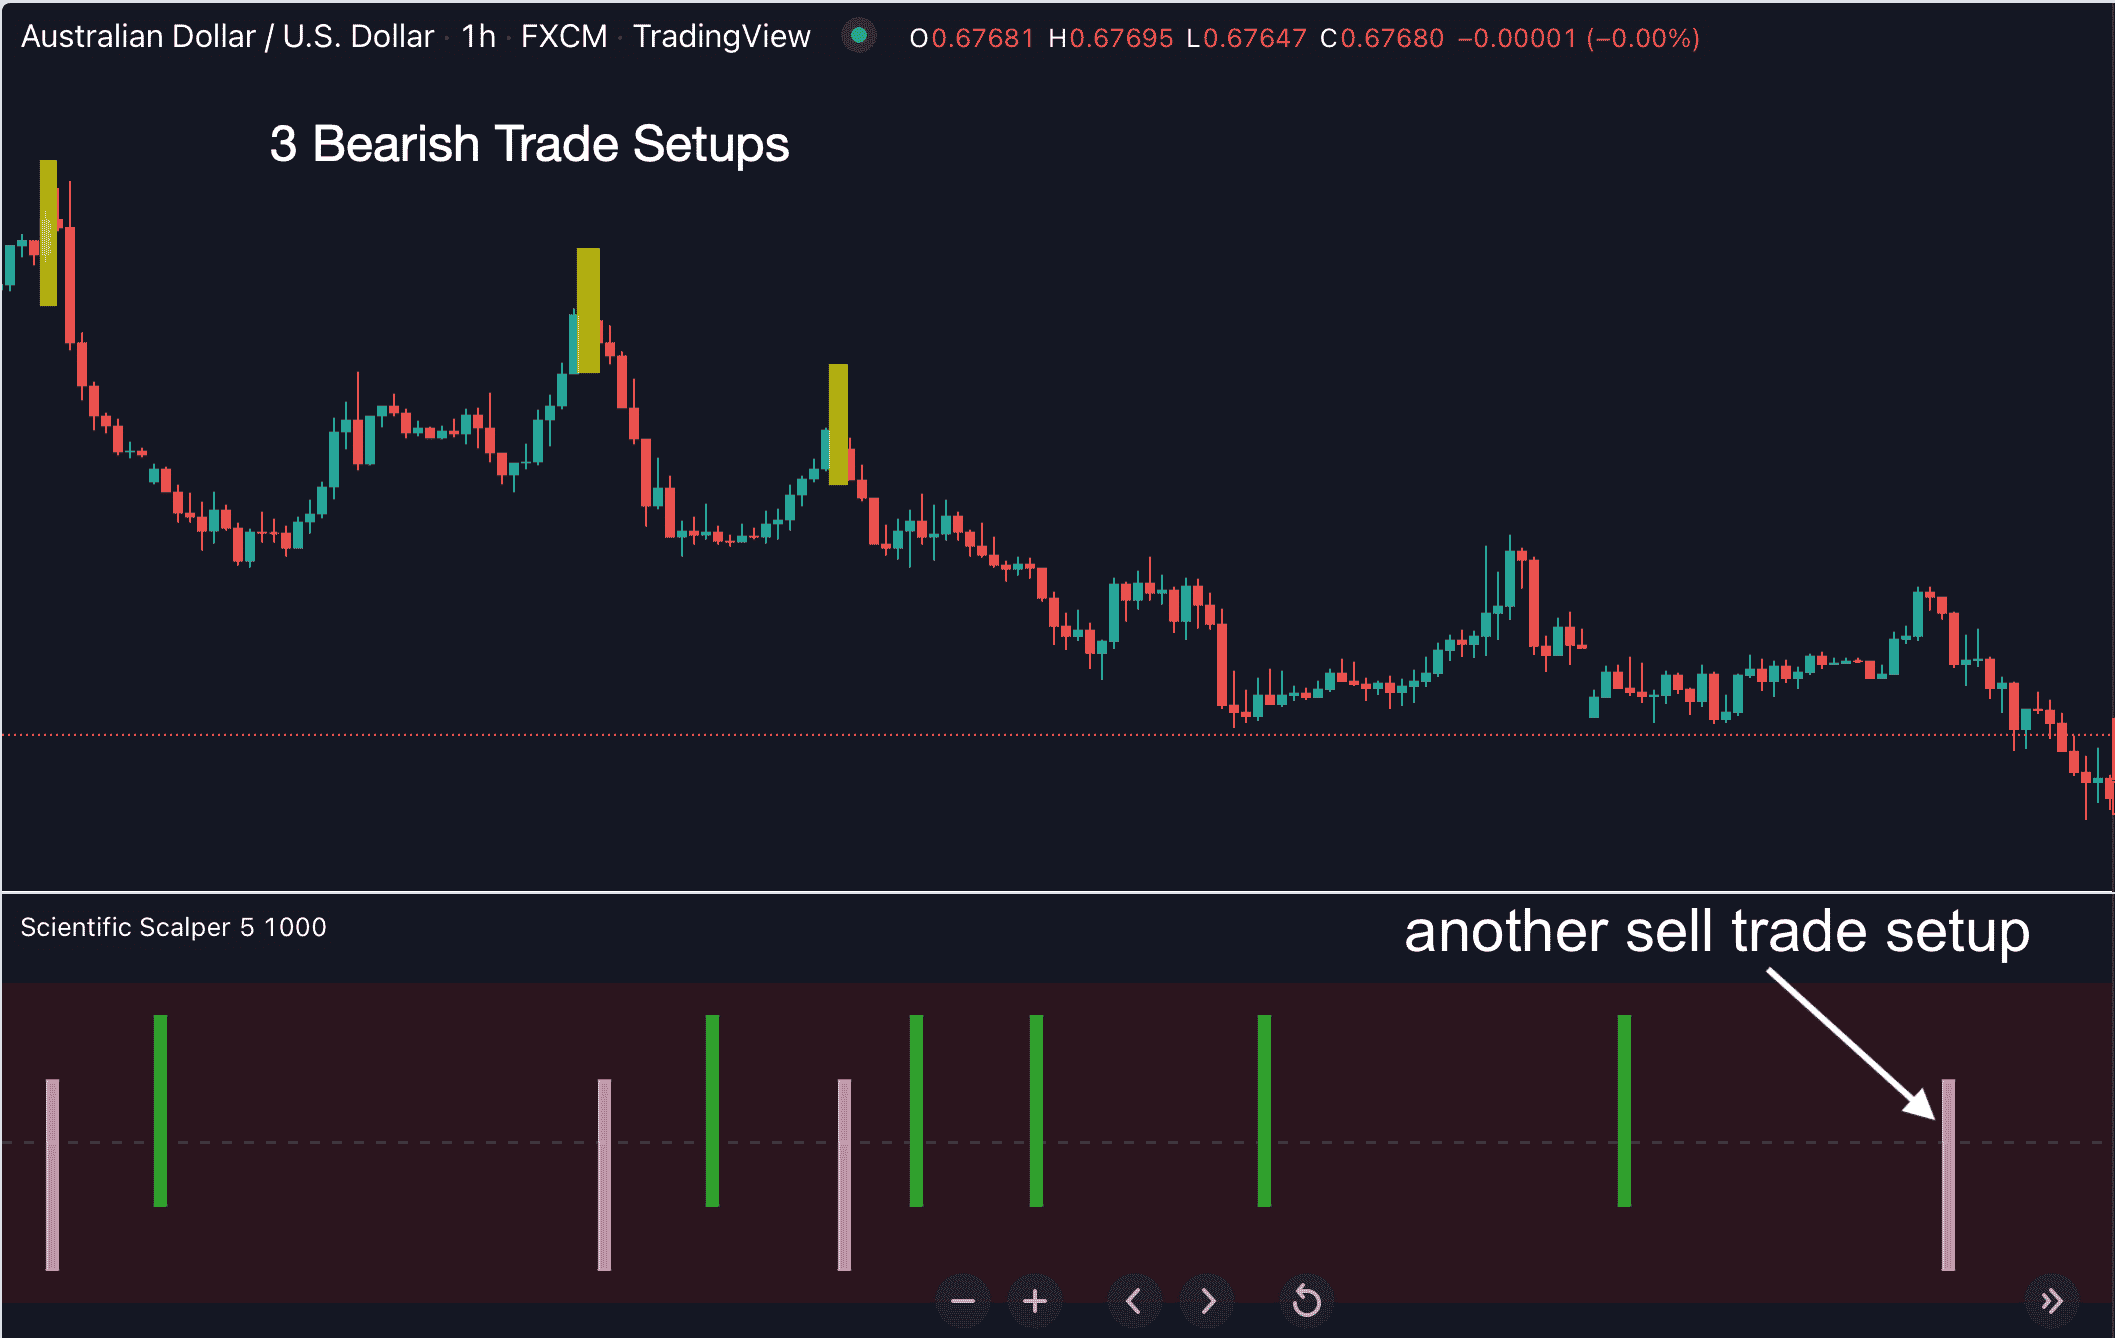
Take a look at an example trade:
As you can see, once again, the indicator didn’t let us down. If we took these scalping trades based on the setups the Scientific Scalper indicator gave us, the maker would have gone in our favor. Quite easy and straightforward. Just the kind of trades we want, don’t you think?
And here’s where it gets even more interesting. Let me give you…
My exact strategy (for maximizing the chance of winning) based on this Scalping Trading indicator...
The Scientific Scalper indicator is extremely flexible. It works with and complements your existing trading strategy.
That said, I’d like to give you my personal strategy for scalping trading with this amazing indicator. This would serve as a useful starting point. So, take this strategy, add your own ideas, test it and make it your own. This is the only real way to become a profitable trader in the long run.
So here it goes:
1. Switch to a higher time-frame (like 4-hour), and use the Scientific Scalper indicator to determine the trend on this higher time-frame.
Let’s take a look at this example:
In this example, the background of the Scientific Scalper indicator is red, indicating that the trend on the 4-hour time-frame is down. So we’re only looking for selling opportunities.
2. Next, we switch to the 15-minute time-frame and use the indicator to determine the current trend on this time-frame…
As you can see, on the 15-minute time frame, the background of the indicator panel is red. This means the trend on this 15-minute time frame is also DOWN. That’s exactly what we want to see.
Now, the next step is important if you trade FX pairs:
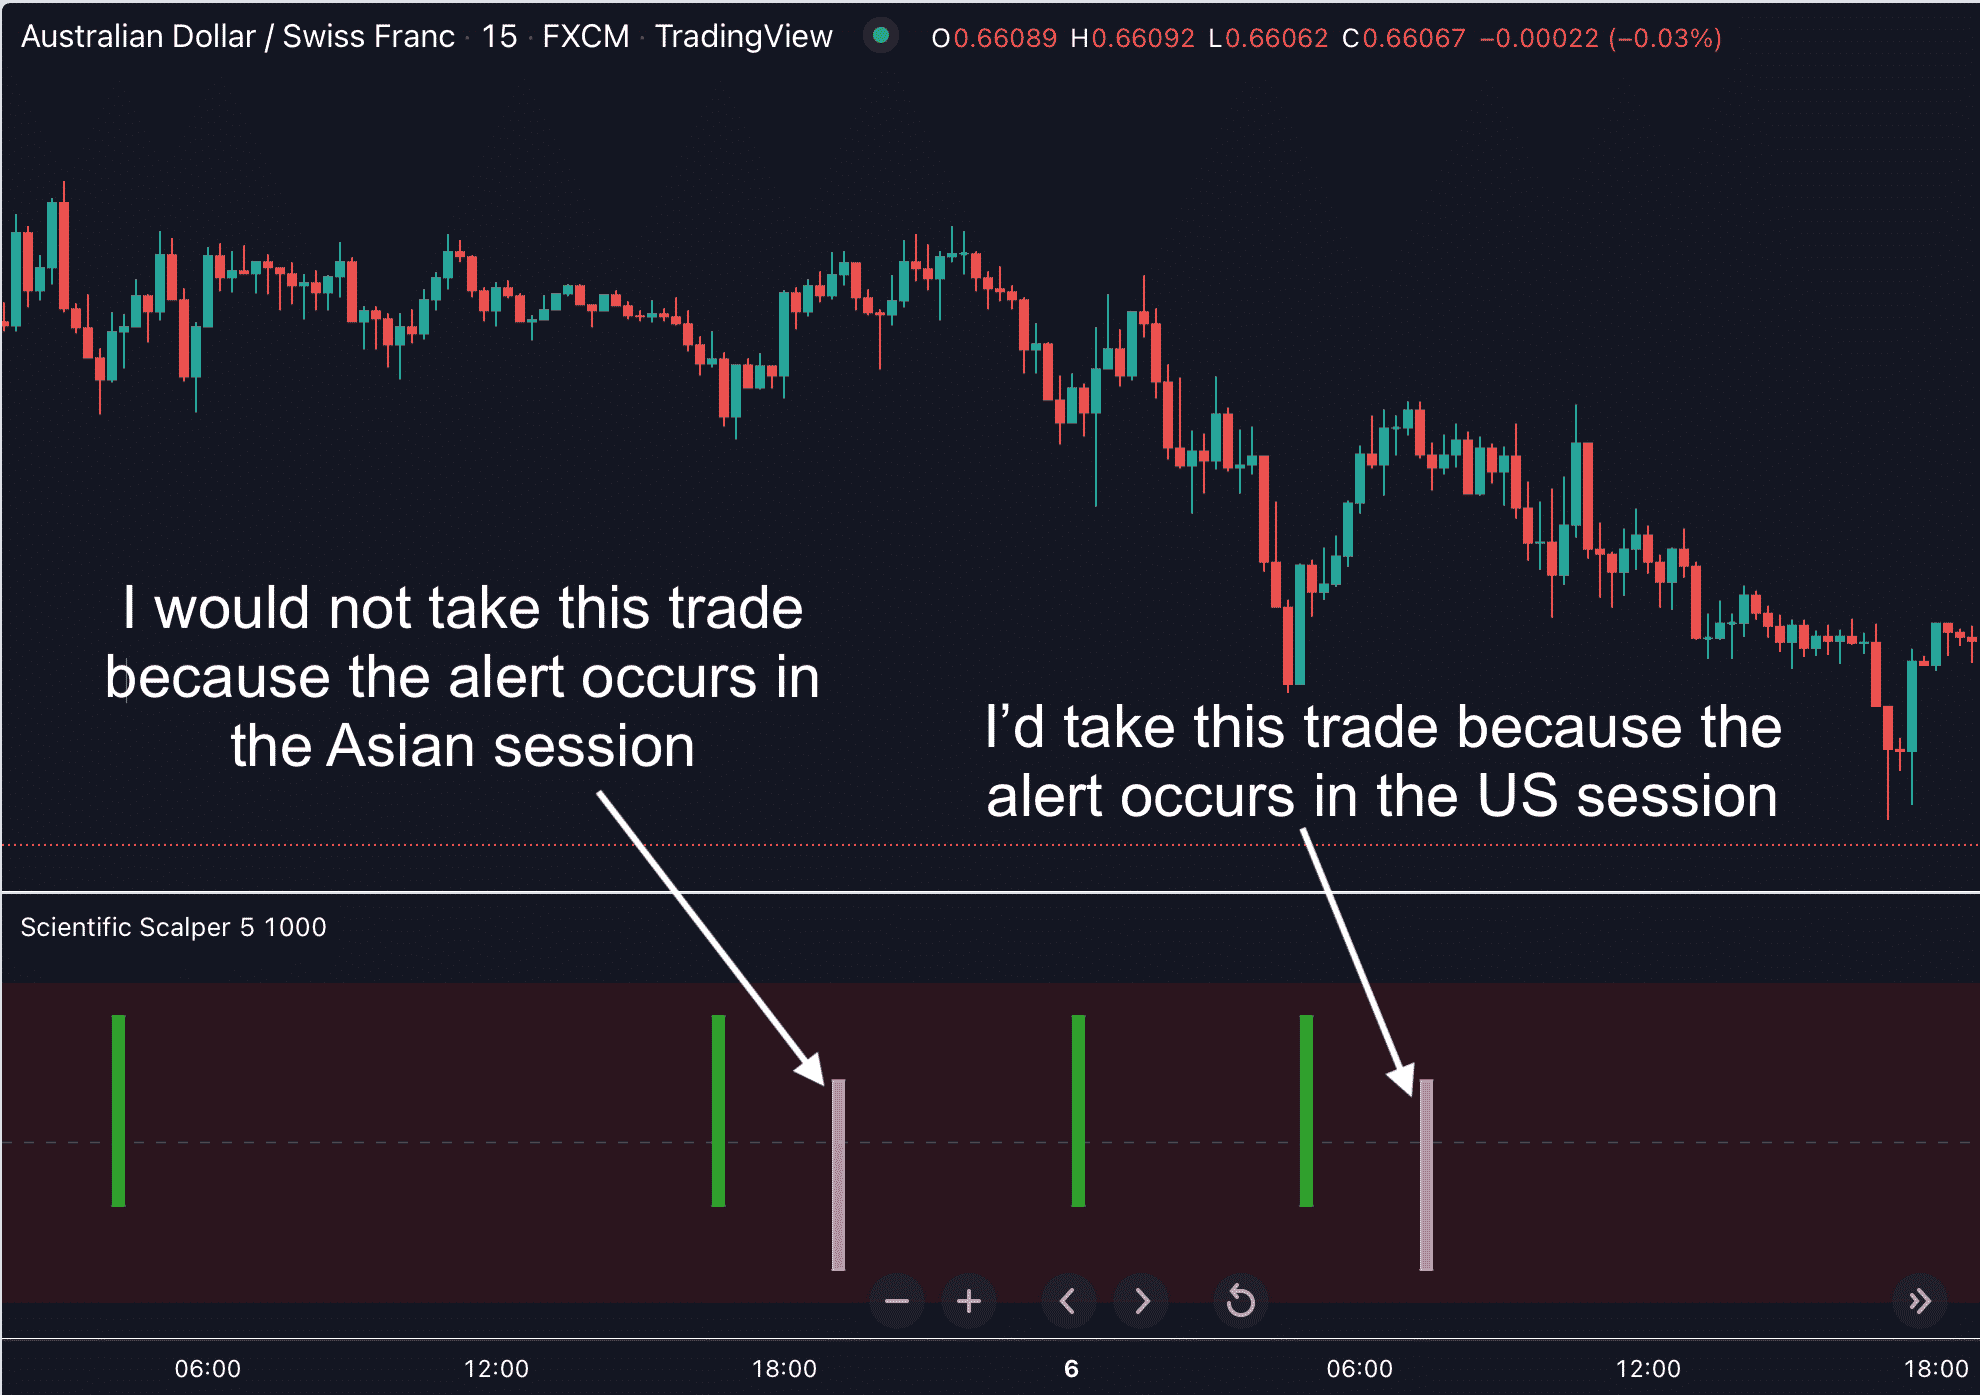
3. (IMPORTANT for FX) We personally only take the trade if the setup occurs in the London session or US session. We would not take the trade in the Asian session.
Here’s what I mean:
So, the first sell opportunity in this example shows up in the Asian session. That’s why we would personally ignore it. The second sell setup shows up in the US session. And we would personally trade this short trade.
Now that we’re in a trade, we need to set our stop loss and take profit levels as follows:
4. Stop loss and profit target:
We set our stop loss at 1.5 x Average True Range (ATR) from our entry price. And our profit target would be two times our stop loss.
For example, if the ATR value for the 15-minute time frame is 10 pips, then we set our stop loss 15 pips away from our entry price. And our profit target would be 2 x 15 = 30 pips.
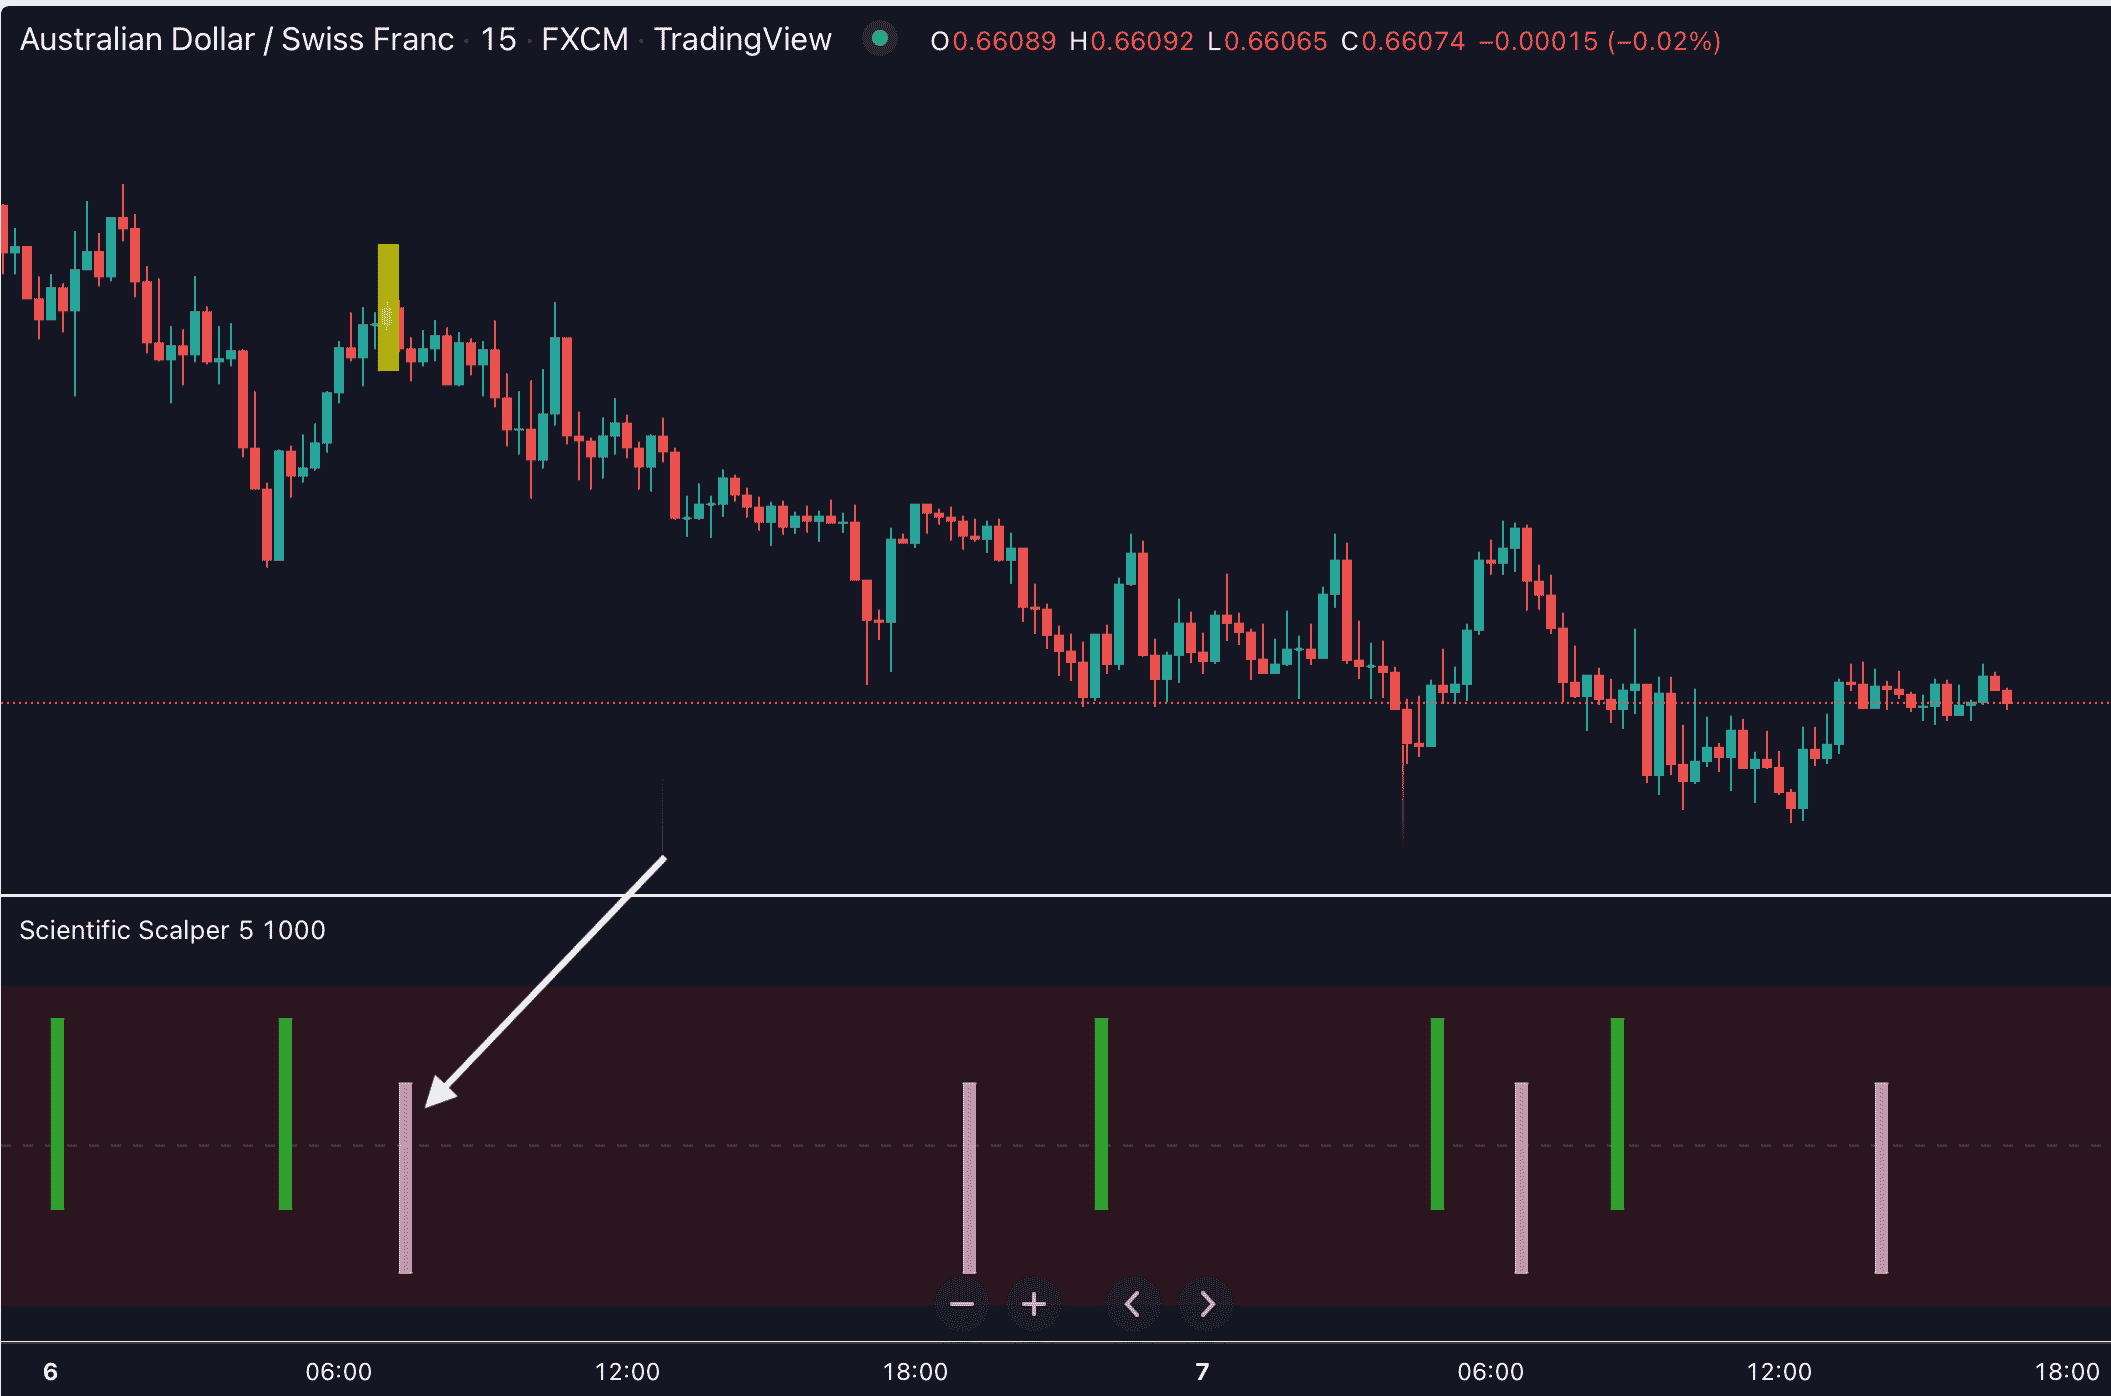
Simple, right? Let’s see what happens next in this trade:
Not too shabby, isn’t it?
And did you know that…
And don’t forget to check out other powerful features of our Scientific Scalper indicator:
- It does all the work for you: Scanning the markets 24/5 for the best, highest-probability SCALPING TRADING and DAY TRADING opportunities while you sit back and relax.
- It improves your technical analysis skills significantly.
- First, it helps you determine the underlying trend direction on ALL time frames with ease.
- Then, it helps you to pinpoint your entries with laser-like accuracy. So you can extract more profits out of any potential trade.
- The “Scientific Scalper” indicator doesn’t repaint… ever!
- It’s very stable and reliable, even in fast-moving markets.
- You can fully customize ALL parameters of the indicator.
But Hang On... We're Not Done...
Further down this page, you’ll notice there are 2 purchase options you can choose.
Option 1: You can get Scientifc Scalper for Tradingview indicator alone for an insanely generous price today.
Option 2: You can join our exclusive TV Champ membership and grab ALL our custom indicators for Tradingview. PLUS all Tradingview indicators that we’ll release in the future.
So What's Inside The "TV Champ" Membership?
First of all, you get the Natural Momentum for Tradingview indicator.
And on top of that, you’ll also get access to the ENTIRE collection of our top-rated custom indicators for Tradingview. Including Supply Demand Pro, Logic Day Trading, Divergence Solution, Pullback Factor, and many more.
Plus, you’ll also get all Tradingview indicators that we’ll release in the future.
To see the full list of all indicators included in the TV Champ membership, click here…
Get Scientific Scalper for Tradingview for $299
1 Indicator
Platform: Tradingview-
One-time payment
-
Lifetime license
-
Get Scientific Scalper for Tradingview
TV Champ
Platform: Tradingview-
Get instant access to ALL custom indicators for Tradingview
-
Get ALL updates
-
PLUS: All future indicators we'll release
Common Questions
Yes, there is. You may check out Scientific Scalper for NT8 here…
These indicators work on Tradingview (both computers and mobile devices)
All sales are final and non-refundable.
Customer feedback


Company
- Indicator Vault
- Contact us
Made by Indicator Vault
Serious Indicators for Serious Traders


