RSI Indicator Explained and Example Strategy
The RSI is one of the most commonly used technical indicators among Forex traders. In this post, we will explain the indicator, covering the following:
- What is the RSI?
- How the RSI is calculated
- How to use the RSI
- Example strategies
What is the RSI?
The RSI (relative strength index) is a momentum indicator used in technical analysis to measure the speed of price movements. It is classified as an oscillator, as it oscillates between zero and 100. When attached to the chart, the indicator is usually displayed in the indicator box under the price chart, and the indicator line moves between the 0 and 100 readings.
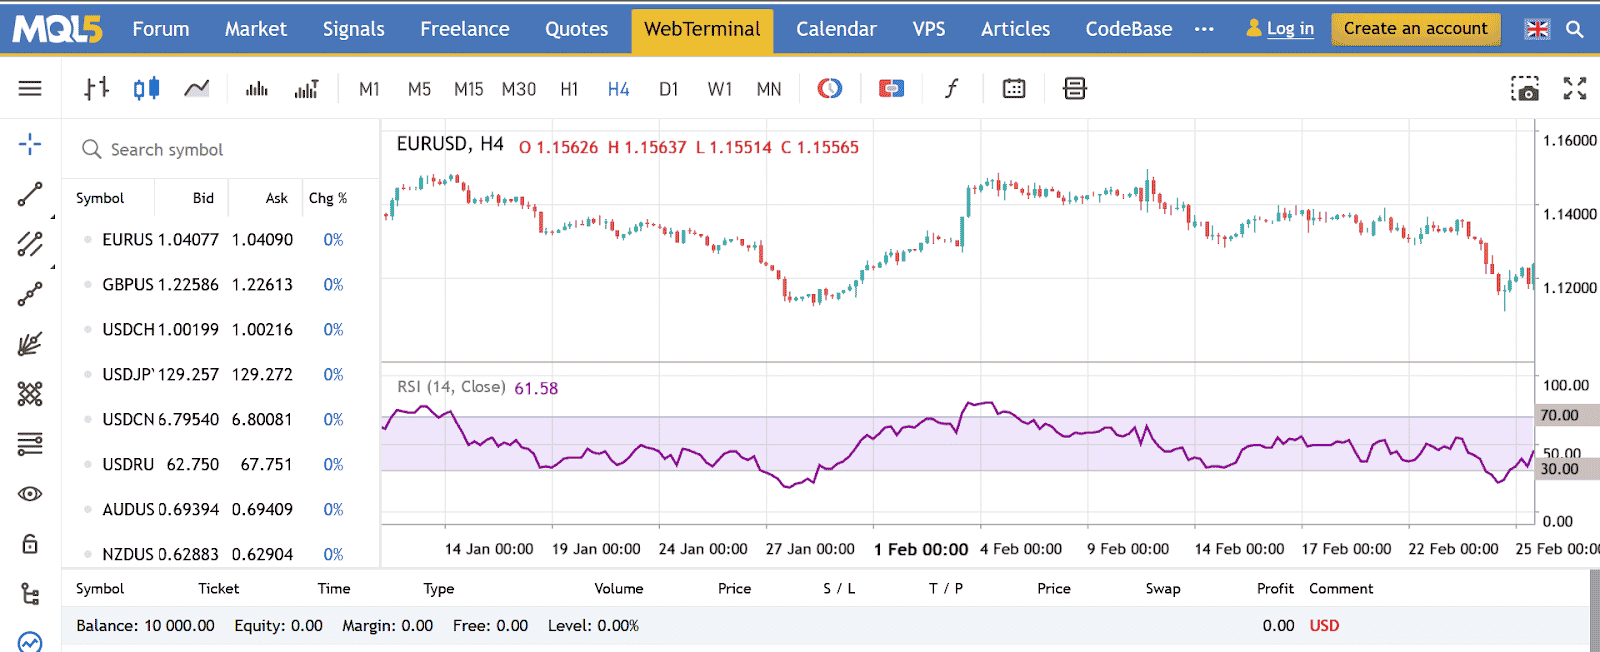
A reading of 30 or lower signifies an oversold market, while a reading of 70 and above signifies an overbought market.
The indicator can also show divergence from the price movements when the price movement and the indicator movement are not synchronized. Originally developed by J. W. Wilder Jr., the indicator was introduced to the trading world in Wilder’s 1978 book: “New Concepts in Technical Trading Systems.”
How the RSI is calculated
The RSI compares the average upward change on the days marked closed higher to the average downward change on the days it closed lower.
To calculate the RSI, the upward change (U) and downward change (D) is calculated first:
U = Close[now] — Close[previous] while D =0
D = Close[previous] — Close[now] while U =0
Both U and D = 0, if both previous close and current close are the same.
Next, the relative strength factor (RS) is calculated with this formula:
RS = SMMA (U, n)/SMMA (D, n)
Where:
SMMA (U, n) = n-period smoothed moving average of U
SMMA (D, n) = n-period smoothed moving average of D
The RSI is then calculated as:
RSI = 100 — [100/(1 + RS)]
Note that from the RS equation above, when the average of D values is zero, the RS value will approach infinity, and thus, the resulting RSI will approach 100. Conversely, when the average of U values is zero, the RS will be zero and the resulting RSI will be zero too.
How to use the RSI
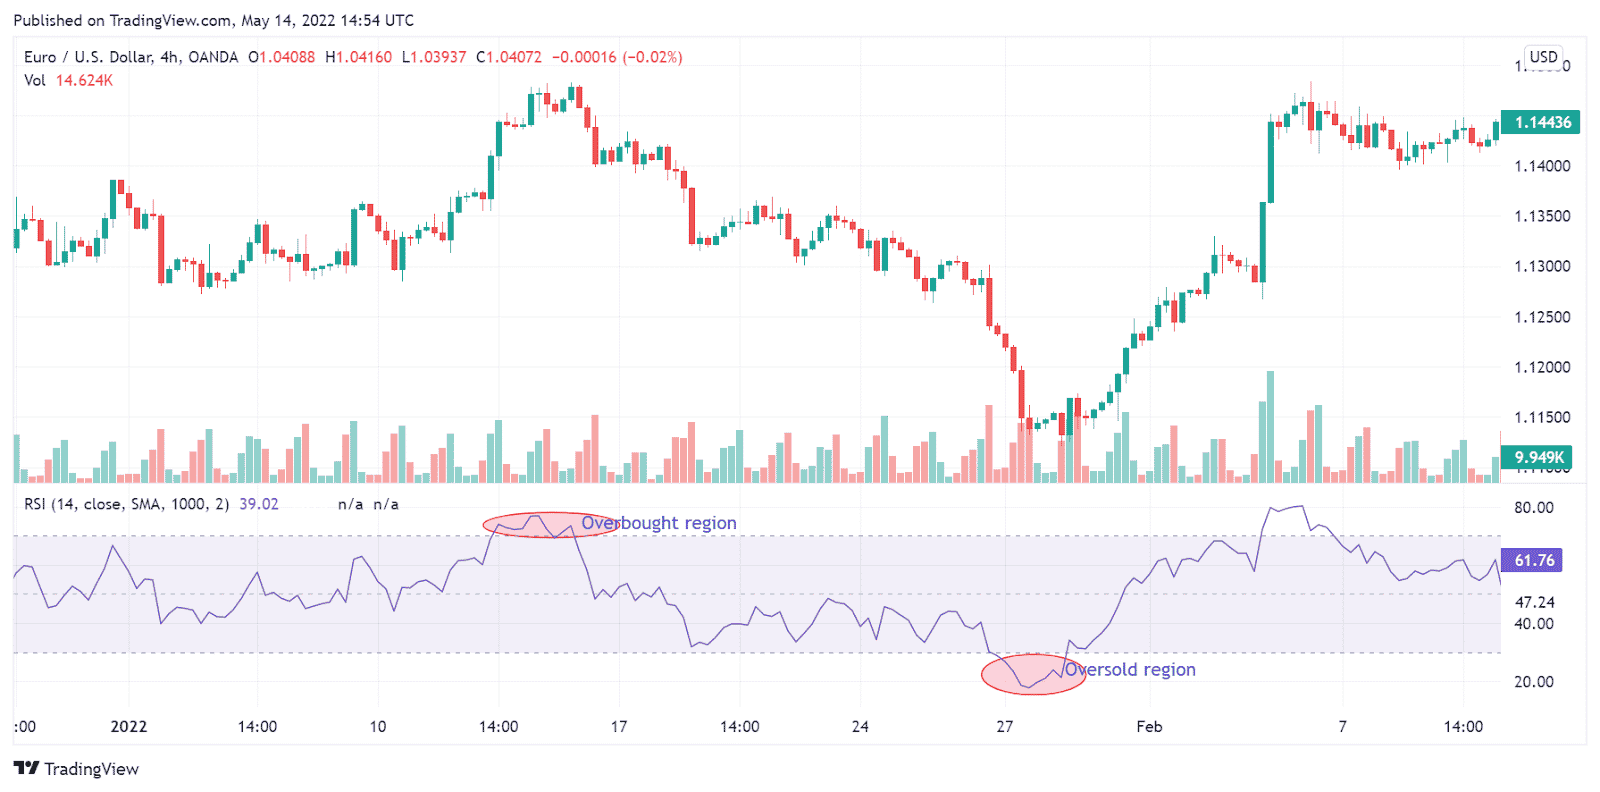
Traditionally, the RSI is used to know when the market is likely overbought or oversold. When the indicator is reading 70 or above, it signifies that the market is likely overbought, which could be a good time to sell. On the other hand, if the indicator is reading 30 or below, it signifies that the market is oversold, which could be a good time to buy. See the chart below:
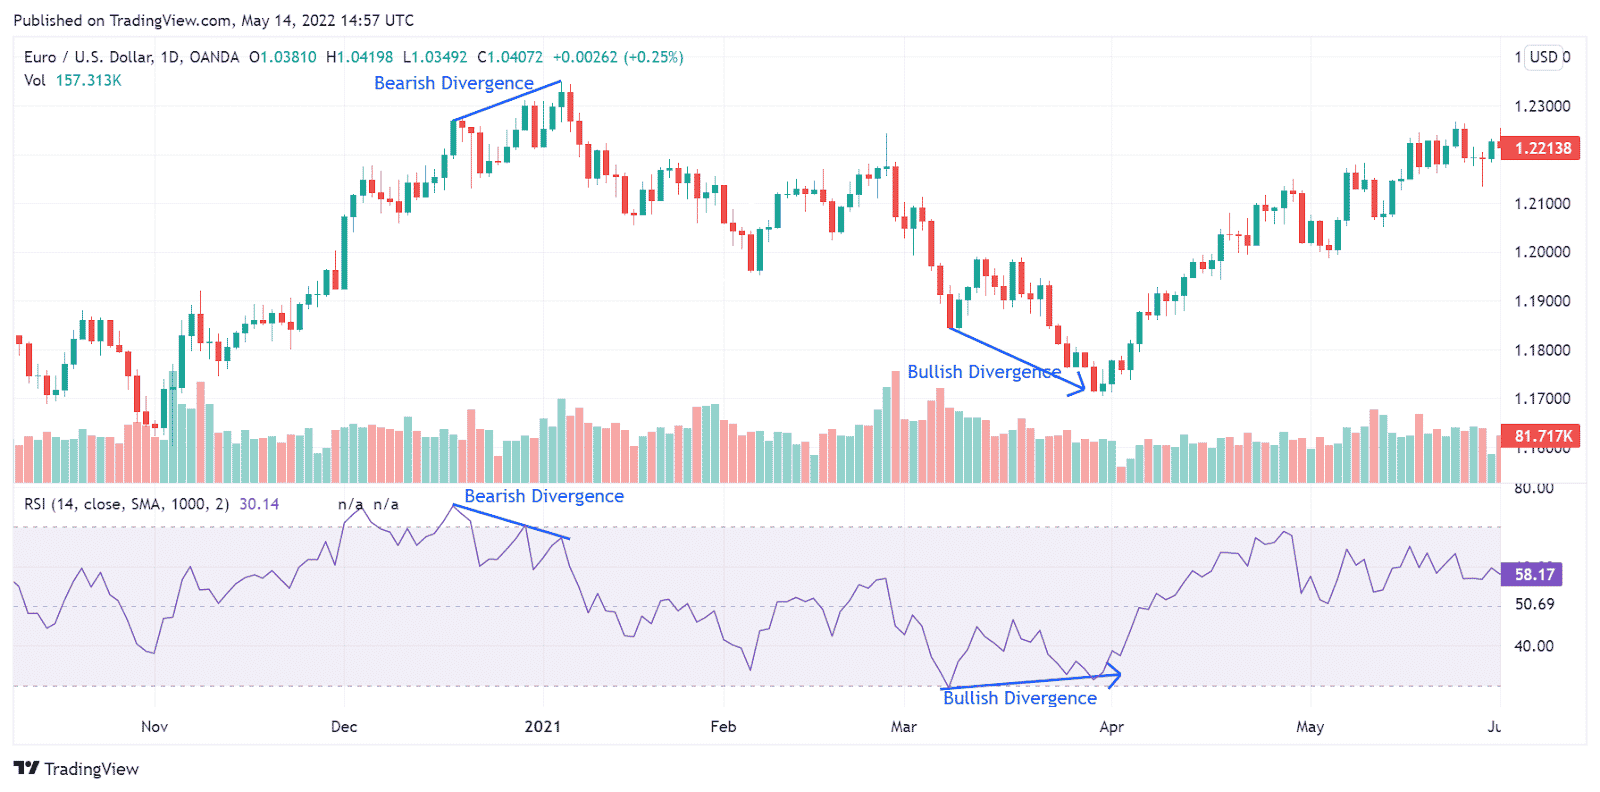
The indicator also shows the divergence signal: if the indicator makes a higher low when the price shows a lower low, there is a bullish divergence, which can be a good signal to go long (buy). If the indicator makes a lower high when the price shows a higher high, there is a bearish divergence, which may be a good signal to go short (sell).
Trade examples
While the overbought and oversold signals can be used to find trading opportunities, especially when combined with trend indicators and support/resistance levels, the divergence signal is considered stronger. Below are a few trade examples using the divergence signals:

Note the entry point after a bullish divergence. The bearish divergence later one is a good signal to exit.

A sell trade after a bearish divergence signal. Exit can be when the oversold region was reached or when a bullish divergence appeared.

