Trading MACD Divergence
The last system we are going to cover is called MACD divergence. With this trading system you can trade any currency pair (I suggest EUR/USD and GBD/USD when you start), and you will always trade with 1 hour or longer term charts.
This system can be used to make trades that you will hold for a day or two with the hourly charts. It can also be used with longer term charts to make longer term trades.
With this particular system we are going to be using some more complicated indicators so we will cover those first.
Indicators
We will be using two different indicators with this trading system and they are both oscillators. We will be using the MACD indicator to determine divergence, and we will be using a stochastic indicator to determine entry points.
These indicators can seem complicated to newer traders, so let’s just start with a short discussion about the indicators themselves. By the time you are finished this chapter it should become clear that it isn’t really that complicated at all, it just looks that way.
MACD
The first indicator we want to look at is the MACD (Moving Average Divergence Convergence). It looks like this:
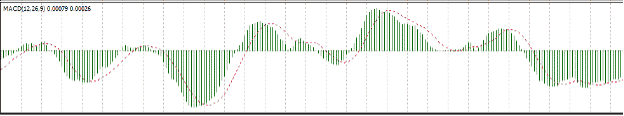
The MACD indicator forms waves relative to the price. What it really does is show the difference between a fast and a slow EMA (exponential moving average). Next to moving averages themselves, MACD is likely one of the most used indicators in Forex.
Using the MACD we can determine the trends and more importantly we get a solid indicator of when a trend is about to change. Looking at the MACD indicator on a chart with the prices, it looks like this:
On the chart with the MACD included, we can see how the indicator follows the trend. When the price was trending up, so was the MACD. By the same token when the price took a turn, so did the MACD.
As the MACD reached the center point, and cross under this is our indication that the trend is likely going to change. In this case it did, it changed from an uptrend to trading sideways in a range for about 2 weeks.
There are actually many ways to use this indicator with Forex. For our purposes we will be using it to find divergence points (which we will cover shortly). If you want to learn more about MACD, Googling it will turn up all sorts of information.
Stochastic
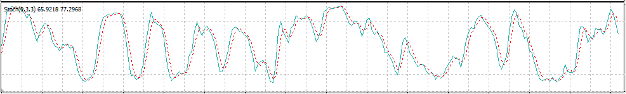
The next indicator that we will be using is called Stochastic. This indicator is a momentum indicator that is intended to show when a market is overbought or oversold. The indicator itself looks like this:
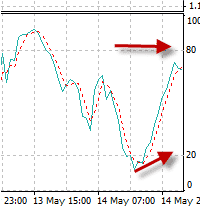 Looking at the screenshot to the left, there are two numbers that matter to us. The 80 and the 20 indicate overbought and oversold regions.
When the two lines on the indicator are above the 80, it is an indication that the market is overbought.
Whenever the lines are below the 20, that is our indication that the market is oversold.
As much as this indicator is an oscillator that speaks of current market conditions, it is also a timing indicator. We will be using this one to time the entry points of our trades to ensure we get into the trades when they have the most profit potential.
System Overview and Chart Setup
With a basic idea of what indicators we will be using, and what we will be using them for, let’s just dive right in. We have a lot of material to cover with this trading system and it all starts with a chart.
Chart Setup
Fire up a 1 hour chart of the EUR/USD or GBP/USD and add the following indicators:
- MACD (12, 26, 9) – This is the standard setting on most charting software.
- Stochastic (%K9, %D3, Slowing 3) – This one may require you to change the setting of the %K. Common charting software like Metatrader defaults it to %K12.
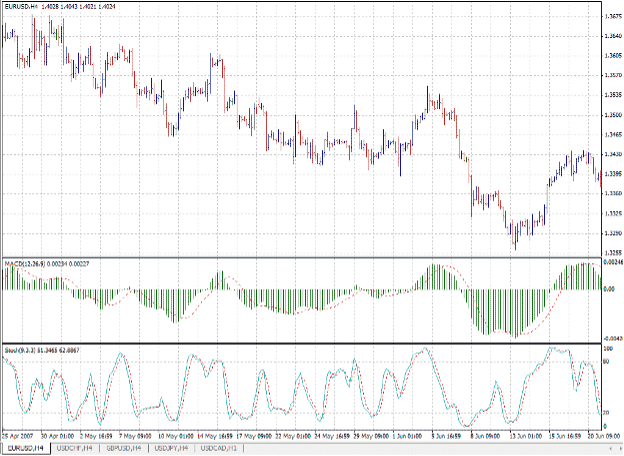
Once you add these indicators to a chart, your chart should look something like this:
Once you have your charts in order it’s time to talk about divergence. The idea itself isn’t really complicated, but newer traders may find this one intimidating, and I do suggest taking the time to familiarize yourself with the charts, and finding divergence points before ever trading with this system.
Divergence in a Nutshell
As it pertains to trading Forex, Divergence is a point on the chart where the price makes a new swing high or low and the MACD does not. This indicates a divergence between price and momentum.
For clarity let’s just put it on a chart:
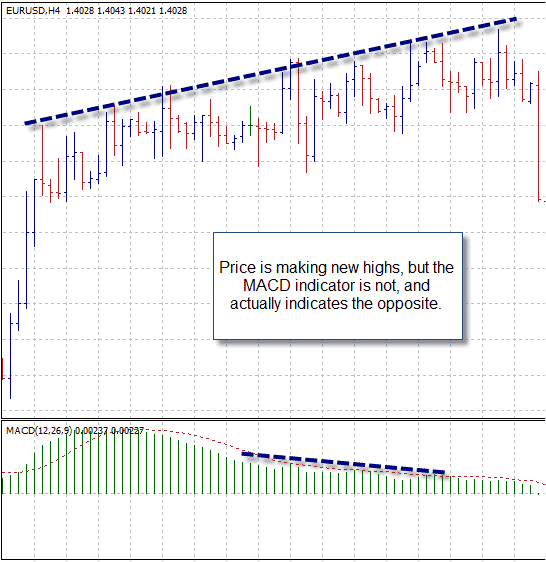
In the chart above, although the trend is slow, the EUR/USD is making new highs. Looking at the MACD though, there are a couple of small hills, but the indicator is on its way down indicating new lows.
What this really tells us is that the trend is running out of steam, and that the currency pair is likely due for a small reversal.
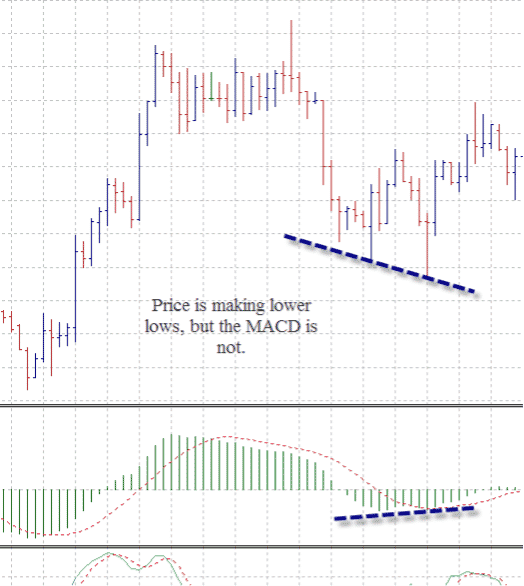
To provide example in a downtrend as well, here is what divergence looks like when the currency is currently falling in price:
For our purposes we need a couple of things to happen when a convergence is showing on a chart for it to be a valid indicator.
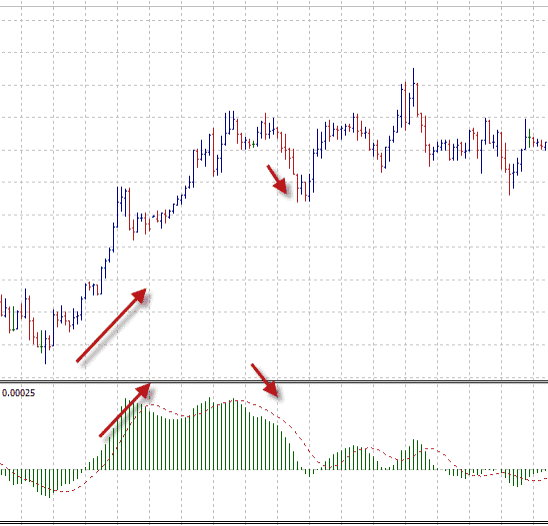
First the MACD indicator must have two clear lower highs or higher lows. In other words the indicator itself will have two hills and a valley in between. To put this in visual form:
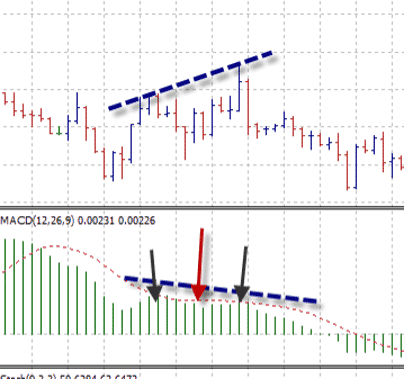
The screenshot above shows a divergence. The MACD has made two lower highs (it’s opposite of the price), indicated by the black arrows, and it has a valley in between which is shown by the red arrow.
This is an example of a valid MACD divergence signal for this trading system. It should be noted that it can have 3 or for hills and more than one valley and still be valid. The important thing is that it isn’t just a slope up or down.
Some traders do use Divergence by itself to trade. However, using it that way tends to give a lot of false signals and you end up with too many losing trades. To compensate we add in the Stochastic which will help us to find our entry points.
Entry Signals and Stops
With an idea of what divergence is and how to identify it on a chart, we need to cover the rules for entering a trade with this system. The rules for short and long trades are basically the same, but since they look different on the chart I want to cover them separately.
With this system we are trying to catch the trend on the reversal, and we’re not actually trading with a trend. Having a clear understanding here is important to staying profitable. So, for both long and short trades, I want to walk through making a trade step by step.
Entry Signals for Long Trades
Step 1 – Identify the Trend and Look for Divergence:
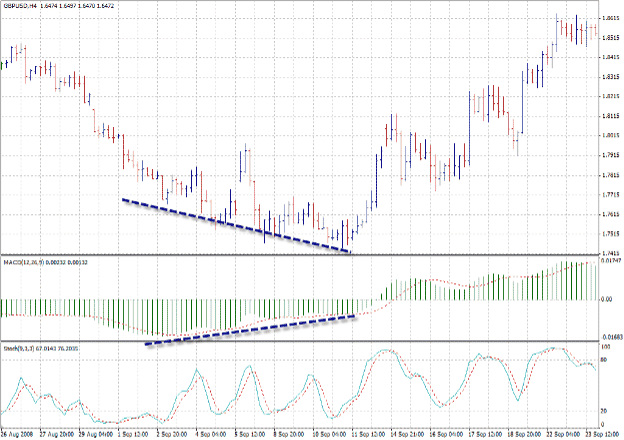
Looking at the chart above (a 4HR GBP/USD chart) we can clearly see that the currency has been in a down trend for a few days now. Looking at the price the trend is still making lower lows which tell us it’s still on its way down.
Looking below the chart at the MACD we see the opposite occurring. The price is making lower lows, but the MACD is making higher lows. We look close at the MACD to confirm that there is more than one higher low. This is easily confirmed by the fact that there are hills with valleys in between when we look at the indicator itself.
Step 2 – Find Your Entry Point:
Once we have a possible buy indicator, we need to wait for an entry point. Zooming in on our char to look closer at the Stochastic indicator we get:
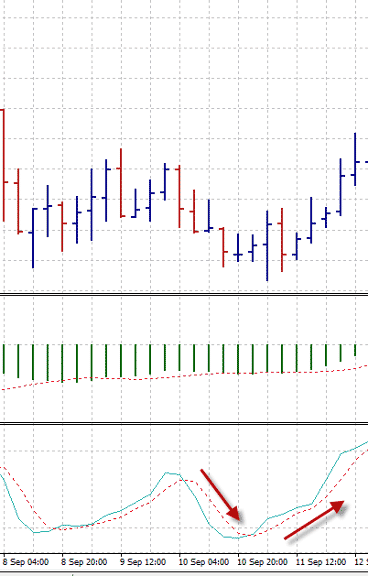
Our entry signal comes when all of the following occur:
- The fast stochastic passes below the 20 mark.
- The fast stochastic line passes back up through the 20 mark.
- The current bar/candle on your chart must close and the line must stay above the 20. This ensures you don’t take a false entry signal.
Once all of those three things have happened we can enter the trade long.
Step 3 – Enter the Trade:
Once you have a clear buy signal and an entry point from the stochastic indicator you simply enter the trade. For a stop set it just back of the last low (about 10 – 20 pips behind).
If that is too large of a stop, and it can be if we are catching a fast swing in a strong trend, use a 20 – 50 pip stop. Since we will often be trading against the trend with this system you don’t want to risk large amounts.
Once the trade moves in your favor by the same amount as your stop, move your stop to the breakeven point.
Entry Signals for Short Trades
When entering a short trade our rules are largely the same, just opposite of what we did for the long trade. Walking through it step by step again:
Step 1 – Determine the Trend and Find the Divergence:
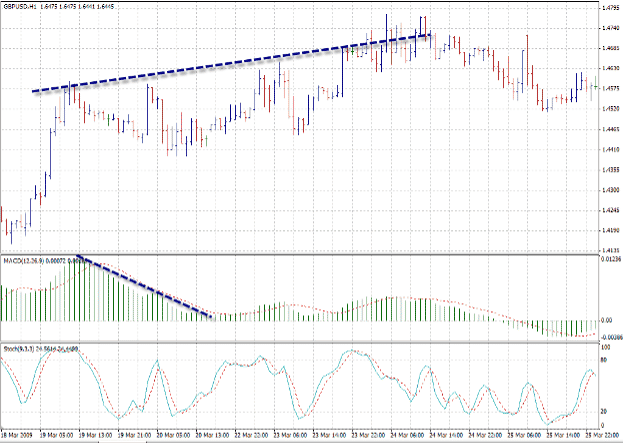
In the 1H chart shown above, the currency is in an uptrend. The trend has slowed somewhat compared to what it was before, but it still is making higher highs. At the same time, the MACD is making lower highs.
This is our indicator that a possible reversal may occur, and it is time to wait for an entry signal.
Step 2 Look for an Entry Signal:
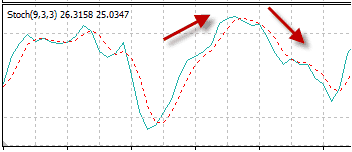
For our entry signal we turn to our stochastic indicator. After the divergence has occurred on the chart and MACD, all of the following must occur before we enter a trade:
- Fast stochastic moves above the 80 mark
- Fast stochastic turns to move back below 80.
- The current candle/bar must close and the fast stochastic must stay below 80 while it does.
Step 3 Enter the Trade:
Once you have a clear sell signal and an entry point from the stochastic indicator you simply enter the trade. For a stop set it just above the last high (about 10 – 20 pips behind). If this stop is too much, use about a 20 – 50 pip stop on the one hour charts (more on a longer term chart).
Again, once the trade moves in your favor by the same amount as your stop, set your trade to the breakeven point.
Exit Rules
Once you are in a trade using this system, the exit rule that you use will depend on the market condition you are trading. There are two main times that you will see indicators appear for this system:
- In a trend – If the currency is currently in a strong up trend or down trend you may get a buy or sell signal that will allow you to catch the swing back as the currency retraces.
- On the reversal – When a trend has completely run out of steam and the trend itself is reversing you will often get signals from this system.
The exit strategies for each market condition are different. If you are catching the retracement you should shoot to earn double what you originally set your stop at. This is simple to do with a take profit level.
In the case of a complete trend reversal I like to move my stops as the trade moves in my favor. Often you will find that upon reversing a trend will begin to move the other way quite quickly. In this case a trailing stop will work just as well.
Trade Example
Before we finish off with this trading system, let’s look at an example trade. Here is a trade that I made off the 1 HR GBP/USD charts in June. This one actually came within a few pips of stopping out on me, but it did turn in my favor and ended up being a profitable trade:
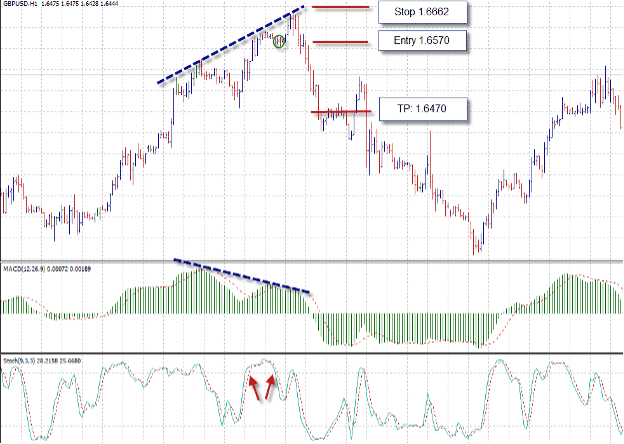
Looking at the chart above, the currency is currently trending up, and it had been for some time. The price is making higher high, but the MACD is making lower lows.
Looking at the stochastic below it, I got an entry signal at about the same time the second hill on the MACD had finished forming. I took this signal, and initially I set a 50 pip stop.
The currency pair actually climbed to within three pips of my stop, but then it turned again and started to go in my favor. Once it did turn the trade began to move fairly quickly, and I identified it as a reversal.
With this trade I held it for two days and just set my stop to the breakeven point. I exited this one manually when a news release caused the currency pare to shoot up for a couple of hours. The end result:
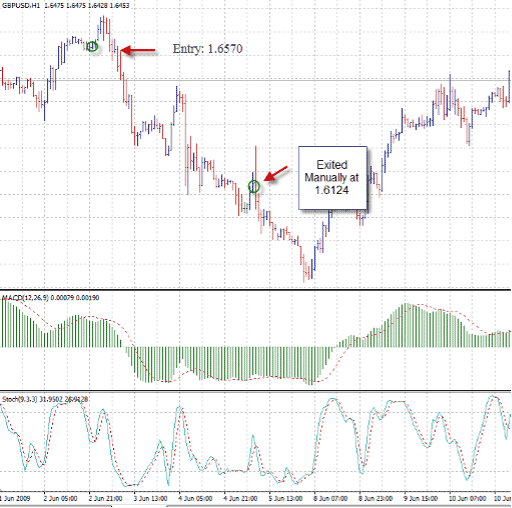
I exited the trade at 1.6124 and earned a total profit of 446 pips in just two days.
You now have five separate trading systems that you can use to ensure that you consistently earn profits in the world of Forex. If you ask me which one you should use most often, the answer is actually all of them.
With all of these systems combined you will be able to trade any market, at any time, and you will always be working to move your account ahead. This is the real secret to earning huge profits in the world of Forex. Not getting stuck in the “my trading system” mentality and always having a method you can use to trade will help you move forward in your Forex career.
Really, even if you only ever trade part time, you should take the time to learn all of the systems I have given you, and learn them well. Doing so will ensure you keep earning; even while the trader down the street is losing his shirt because he doesn’t have a system that fits with the current market conditions.
To Your Success in Forex (and Huge Profits),