The MACD Indicator review
When Gerald Appel made this indicator in the 70s, no one expected it to become one of the most popular technical analysis tools with so many applications and modifications. This merit comes from its simple presentation that beginner traders spot immediately – two lines converging and crossing and picking great entries. MACD is also a zero line cross indicator, an oscillator, and a moving average cross indicator. However, this swiss-army-like indicator creates skepticism among certain contrarian traders who advocate the use of other, specialized indicators.
MACD – a ready-made trading system on default settings?
On the other hand, MACD can be considered a complete trading system, and here is why. A simple trading system that combines 200-period EMA and this MACD is a ready-to-go, proven profitable system that works in any market. It is tested by many traders and the rules are simple:
- When the price is above 200 EMA, enter long entries only, and the opposite for shorts.
- When MACD lines cross happens below the zero line on the MACD this is your buy signal, and the opposite for shorts.
What you will see is that this system picks great pullback entries in an already established trend.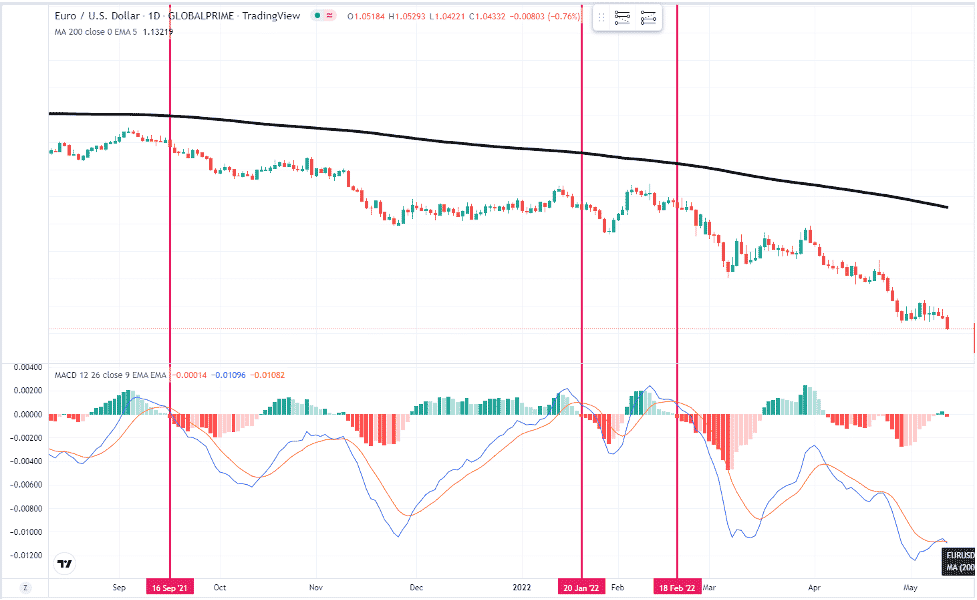
1 Sell signals (red vertical lines) on recent EURUSD Daily timeframe trend. Source: TradingView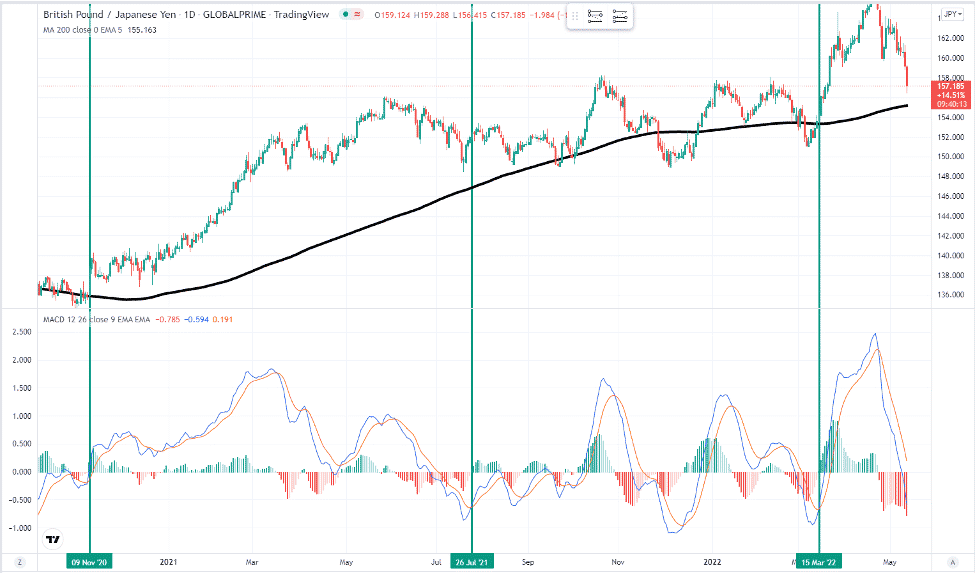
2 Buy signals (green vertical lines) on GBPJPY Daily trend. Source: TradingView
When MACD does not work?
Using an adequate Stop Loss and Take Profit ratio the system above generates proven, consistently positive gains. However, MACD fails in ranging markets and trends with shallow pullbacks:
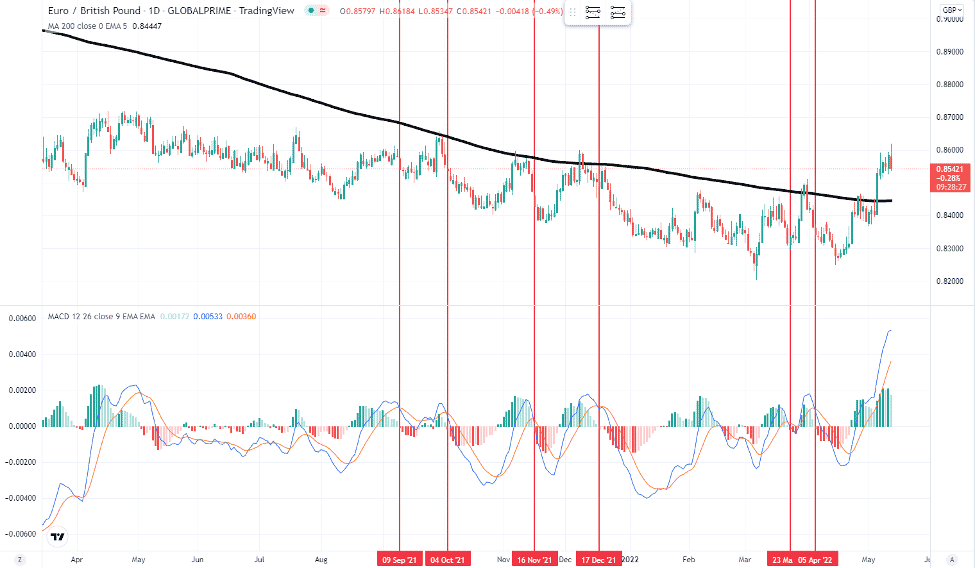
3 Sometimes late sell signals (red vertical lines) appear. EURGBP daily timeframe. Source: TradingView
In such conditions an easy solution could be to go to a lower timeframe, MACD just works on any.